Absorption vs exhaustion in order flow, explained
Effort without result or a move out of fuel: how each prints on the footprint, the book and delta, and how to trade it with a stop in ticks.
Absorption and exhaustion both stop a move, but for opposite reasons. Absorption is effort without result: heavy aggressive volume keeps hitting a level and passive limit orders soak it up, so price does not move. Exhaustion is the absence of effort: the aggressors simply stop showing up at the extreme, and the move dies for lack of participants.
Absorption: effort without result
Absorption is when aggressive market orders keep trading into a level and price fails to move through it, because a passive buyer or seller is filling all of them. At a low, sellers hit the bid again and again, the volume at the bid is large, and the low holds. Someone with limit orders is taking the other side of every contract.
The key word is effort. Volume is high, delta is strongly on one side, and price makes no progress. That mismatch tells you the pushing side has met a larger participant who is happy to be filled there.
Exhaustion: the move runs out of participants
Exhaustion is when aggression dries up at the extreme of a move, and price stops because nobody is left to push it further. No wall or big passive player is needed. Each new low is made on fewer contracts than the one before, the last prints are thin, and the auction ends on its own.
Where absorption is loud, exhaustion is quiet. The tell is what is missing: volume and urgency fading while price still makes marginal new extremes.
How each one prints on the footprint
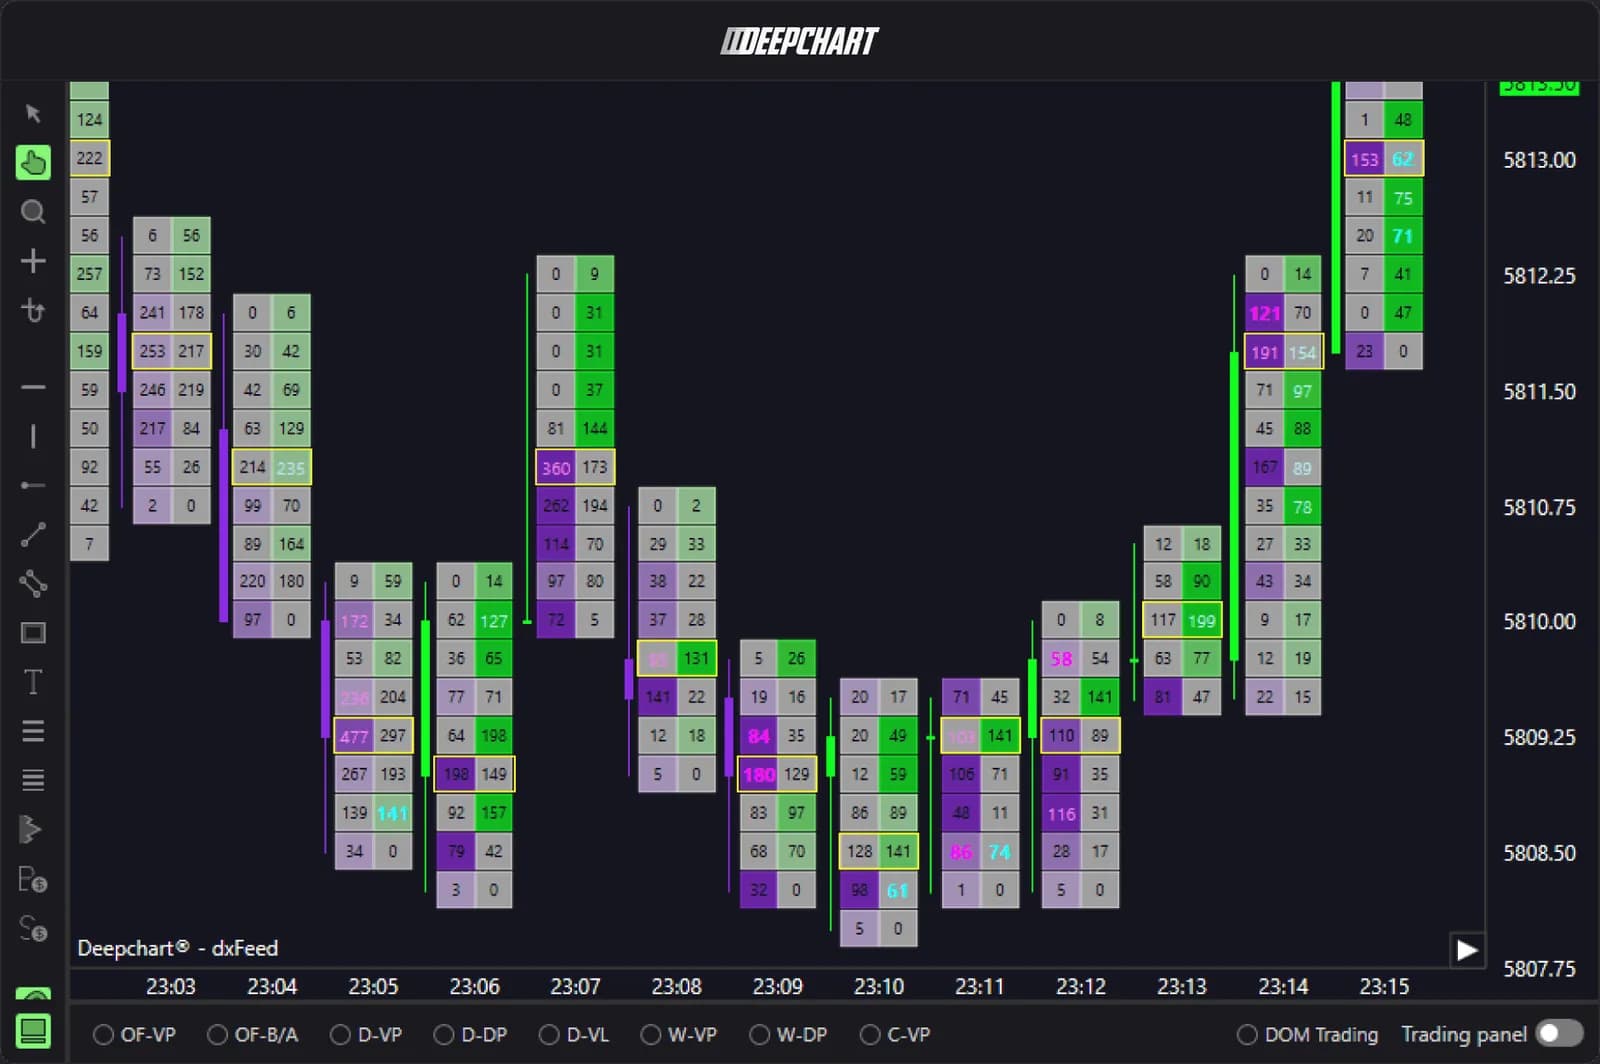
On a footprint, absorption shows as large numbers on the aggressive side at the extreme, while exhaustion shows as small or zero numbers there. If you need a refresher on reading cells, start with reading a footprint chart. Here are two hypothetical lows on NQ, cells written bid × ask:
| Price | Absorption low | Exhaustion low |
|---|---|---|
| 21,003.00 | 41 × 37 | 62 × 40 |
| 21,002.75 | 88 × 52 | 31 × 28 |
| 21,002.50 | 174 × 61 | 9 × 17 |
| 21,002.25 (low) | 296 × 68 | 0 × 23 |
Absorption at the low
In the left column, selling grows as price falls: 296 contracts sold into the bid at the low, and the bar still does not trade one tick lower. The bar often closes off its low, and the next bar fails to break it.
Exhaustion at the low
In the right column, selling fades as price falls, and the last tick shows 0 × 23: not one contract sold at the bid on the low. Sellers stopped hitting before price stopped. That is a finished auction, and it usually comes with lower total volume on the bar than on the bars that started the move.
What delta adds
Delta separates the two cleanly. In absorption, delta is strongly negative at a low, sometimes the most negative of the move, while price holds: a divergence between effort and result. In exhaustion, delta shrinks push after push. A new low prints with a delta much smaller than the previous one, and cumulative delta flattens. The delta and cumulative delta guide covers how to read both over a session.
Confirming passive size on the book
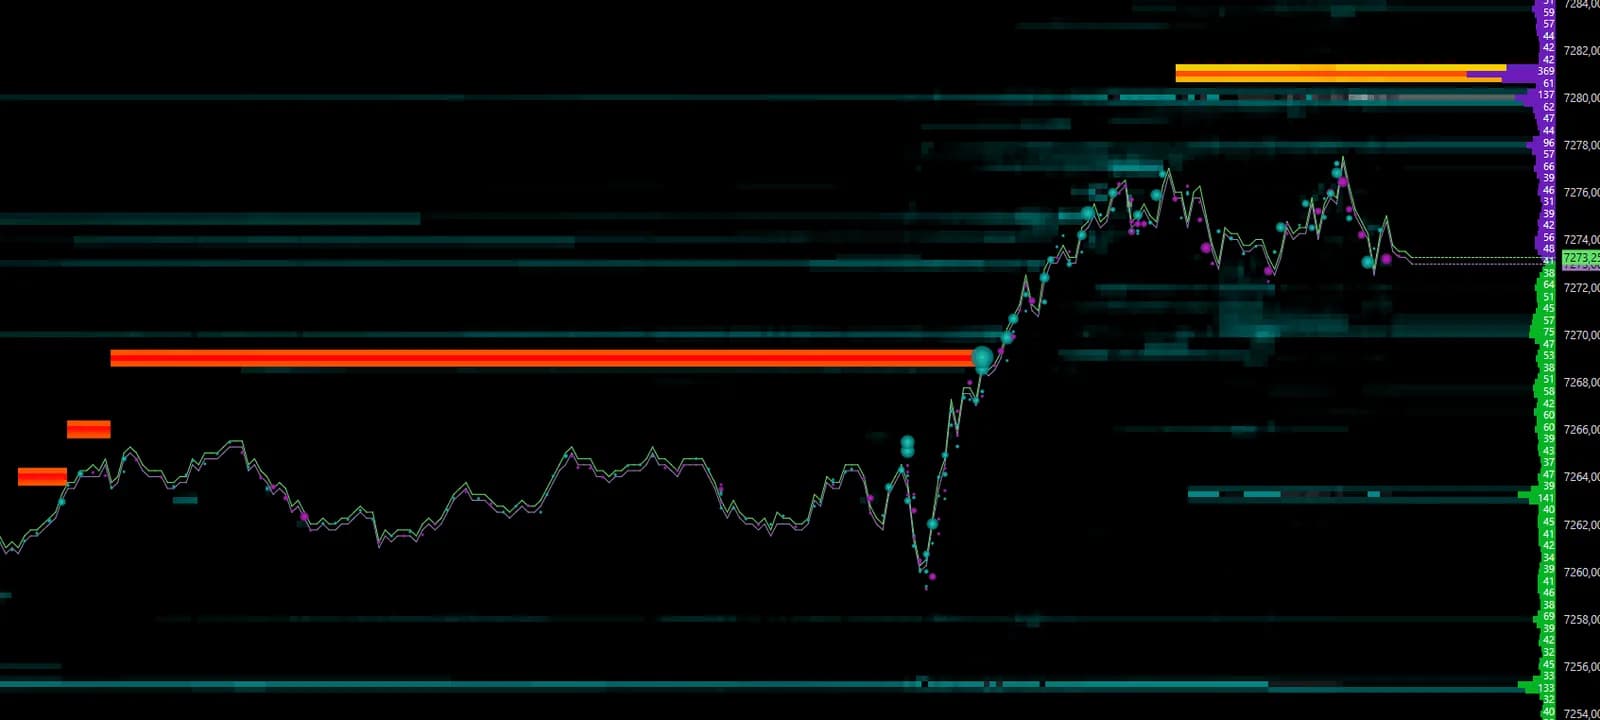
The book confirms absorption when the bid at the level keeps refreshing as it is hit, instead of shrinking and disappearing. On a plain DOM you see size traded at the bid, but the resting quantity at that price stays about the same or comes back after each fill. On a liquidity heatmap, the band at that price stays hot while trades pound into it.
DeepDomOFF tracks each order individually, so a real wall and an order that refills look different. Its Iceberg Detector flags hidden orders that show a fraction of their size and refill after each fill, with the detected size marked on price. An iceberg sitting under a low that keeps absorbing sellers is the clearest confirmation you can get that passive size is defending it. The liquidity heatmap guide shows how to tell a defended level from one that pulls.
Exhaustion has no such signature on the book. Price stalls in ordinary liquidity, and what you watch is the tape: trade size and frequency falling off at the extreme.
Absorption and exhaustion side by side
The simplest way to tell them apart is to ask whether volume at the extreme is high or low. The rest follows from that.
| Absorption | Exhaustion | |
|---|---|---|
| What you see | Heavy aggressive volume at the extreme, price does not move | Thin prints at the extreme, 0 × or near zero on the aggressive side |
| Who is in control | A passive player with limit orders | Nobody: the aggressive side has left |
| Delta | Strong on the aggressive side, diverging from price | Shrinking on each new extreme |
| Typical location | Prior high or low, value area edge, round number, visible wall | End of an extended move, far from value, late in a push |
| Confirmation | Refreshing bid or offer, iceberg flagged, price leaves the level | Next bar fails to extend, first push the other way with delta behind it |
| Invalidation | Price trades through the absorbing level with volume | A new extreme made with fresh aggression |
How to trade each one with a defined stop
Trade both the same way: wait for price to leave the level, then put the stop beyond the price that absorbed or the extreme that exhausted. Neither pattern is an entry by itself.
Trading absorption
Do not buy into the absorption while it is happening: the passive buyer may be about to be overrun. Wait for price to lift away from the level, for example back above the high of the absorption bar, and enter on that move or on a first retest that holds. Your stop goes a few ticks beyond the absorbing price, not on a round number nearby.
Trading exhaustion
Exhaustion needs one more piece of evidence, because a thin print alone is not a reversal. Wait for the next bar to fail to extend, then for a first push in the other direction with delta behind it. The stop goes beyond the exhausted extreme. Entries are usually further from that extreme than with absorption, so the stop in ticks is wider.
A worked example
Take a 50K account with a 2,000 dollar drawdown, and a personal rule of risking 100 dollars per trade, 5% of the room. All numbers are hypothetical.
- Absorption long: low at 21,002.25, stop 3 ticks below at 21,001.50, entry when price lifts back to 21,004.25. That is 2.75 points, or 11 ticks. On NQ, 11 ticks cost 55 dollars per contract: 1 contract. On MNQ, 5.50 dollars per contract: 18 contracts for 99 dollars.
- Exhaustion long: same low, same stop, but entry only after the confirming push at 21,006.00. That is 4.5 points, or 18 ticks. On NQ, 90 dollars: 1 contract. On MNQ, 9 dollars per contract: 11 contracts for 99 dollars.
Same idea, same risk, different size: the wait for confirmation is paid for in ticks. The position size calculator does this sum for any drawdown and instrument. Even a clean read is wrong often enough that the size has to survive a string of stops.
The traps that cost the most
The most expensive trap is absorption that breaks. When the passive player is fully filled or steps away, every seller who was absorbed is now right, every buyer who leaned on the level is trapped, and the stops sitting under it become fuel. Price often accelerates through a failed absorption level faster than it approached it.
The signs: the bid stops refreshing, an iceberg is filled and not replaced, and volume trades through the level instead of into it. Take the stop and do not average down. A broken absorption is often a better continuation trade than the reversal ever was.
Three smaller traps:
- Calling exhaustion inside a strong trend. One thin print in a market that keeps pushing is a pause, not an end. Wait for the failure to extend.
- Absorption in the middle of nowhere. It matters most at a level the market already cares about. In the middle of a range it is just two-sided trade.
- Thin hours. Overnight, most prints are small, so a thin extreme means less.
How to practise both in replay
The fastest way to learn the difference is to watch the same lows again and again in replay, slowed down, before the outcome is known. Load a past NQ session in the DeepChartsOFF tick replay, find the swing lows and highs, and call each one out loud: absorption, exhaustion, or neither.
The Deep V-Tracker module in DeepChartsOFF marks exhaustion of aggressive flow and draws absorption zones with key levels and invalidation labelled, which makes it a useful answer key while you train your own eye. The tool overview lists what each one does and what it costs.
Firms that run DeepCharts