Delta and cumulative delta (CVD) explained
Ask minus bid, bar by bar and across the session: how to read delta and CVD against price, spot a divergence, and trade it with a defined stop.
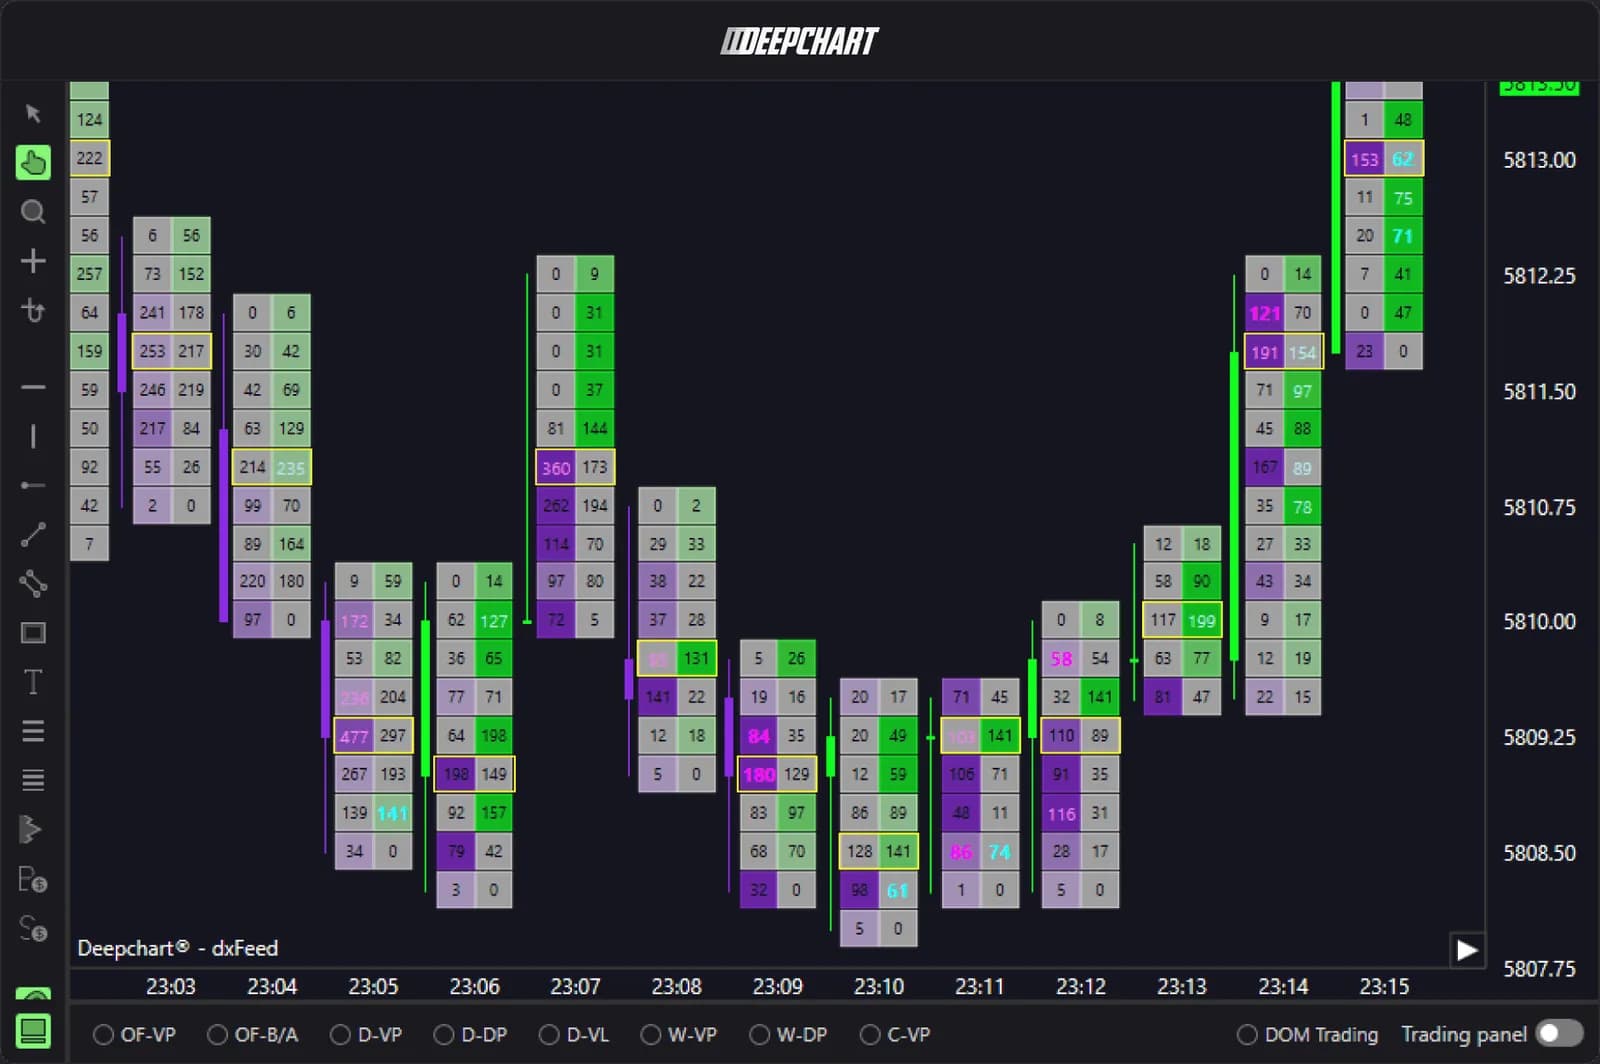
Delta is the volume bought at the ask minus the volume sold at the bid: it counts which side was aggressive in a bar, or at one price inside it. Cumulative volume delta (CVD) is the running total of those bar deltas since the session opened. Neither tells you where price goes next. Read against price, they tell you whether a move is being pushed by aggressive orders or is drifting without them.
What delta measures
Delta measures the difference between aggressive buying and aggressive selling over a given slice of time or price. Every trade has two sides: a resting limit order and a market order that hits it. The market order is the aggressor. When a buyer lifts the offer, the volume counts at the ask. When a seller hits the bid, it counts at the bid.
- Bar delta: ask volume minus bid volume for the whole bar. A bar with 2,300 contracts at the ask and 1,800 at the bid has a delta of +500.
- Delta per price: the same subtraction, row by row, inside a footprint. It shows where in the bar the aggression happened: at the high, at the low, or in the middle.
If the footprint cells are new to you, start with reading a footprint chart: delta is the first number built on top of them.
Cumulative delta across the session
Cumulative volume delta is the sum of every bar delta since a chosen start point, usually the session open. Each new bar adds its delta to the total: +500 after a total of +1,200 gives +1,700, and a following bar at -900 brings it to +800.
The level of CVD matters less than its slope. A rising CVD means aggressive buyers have been dominant over the period. A flat CVD during a rally means price is rising without net aggression behind it. The number itself depends on where you started counting, so compare the shape of the line with the shape of price, not today's figure with yesterday's.
Why the aggressor data matters
Delta is only as good as the way each trade is labelled buyer or seller. There are two ways to get that label.
| Method | How the side is decided | Accuracy |
|---|---|---|
| Exchange aggressor flag (CME tick data) | CME market data tags each trade with the side that initiated it | Exact, trade by trade |
| Tick rule or bid/ask comparison | A trade on an uptick, or at the ask, is called a buy; on a downtick, or at the bid, a sell | Estimated, worst in fast markets |
The estimate breaks down when many trades print at the same price, when the quote moves between two prints, or when data is aggregated into one-second or one-minute packets. On a quiet day the two methods look similar. On a news spike they can disagree on thousands of contracts.
DeepChartsOFF reads the aggressor side from the MBO feed, so delta and CVD are built from the exchange flag rather than inferred from tick direction. Whatever platform you use, check how it labels trades before you trust a delta divergence on a fast open.
How to read delta and CVD
Delta and CVD are read against price: the signal is in agreement or disagreement, never in the number alone.
Confirmation
Confirmation is price and CVD rising together, or falling together. New highs in price with new highs in CVD say aggressive buyers are still paying up. That is the boring, healthy case. It argues for staying with the move, not for fading it.
Divergence
Divergence is price making a new extreme while CVD does not. Price prints a higher high, CVD prints a lower high: buyers are no longer pushing as hard to get there. Often this means a passive seller is sitting at the high and absorbing the buying, or that the move is running on thin liquidity, with offers pulled rather than taken, instead of fresh aggressive demand. The difference between those two cases is covered in absorption vs exhaustion.
Delta at the extremes
Delta at the high or low of a bar shows who was active at the turning point. Heavy positive delta at the high with no progress above it is buying that failed: someone passive took the other side. Little or no delta at the extreme, after strong delta in the body of the move, suggests the aggressors simply stopped. The first pattern is absorption, the second looks more like exhaustion.
Min delta, max delta and delta flip
Min and max delta are the lowest and highest values the bar's delta reached while the bar was forming. The closing delta is only the last of them. A bar that closes at +150 but touched -700 along the way tells a different story from a bar that went straight to +150: sellers were in control early and buyers took it back.
A delta flip is that reversal made visible: the delta of the bar changes sign, from deeply negative to positive or the opposite, and closes near the other extreme. At a support level, a bar that sinks to a large min delta and then flips positive is often the clearest footprint read of a failed sell-off.
A worked example on NQ
Here is a hypothetical NQ sequence of five 5-minute bars, with CVD starting at zero at the open of the sequence.
| Bar | Close | Delta | CVD |
|---|---|---|---|
| 1 | 21,040.00 | +850 | +850 |
| 2 | 21,062.50 | +1,120 | +1,970 |
| 3 | 21,048.75 | -730 | +1,240 |
| 4 | 21,068.25 | +310 | +1,550 |
| 5 | 21,045.25 | -640 | +910 |
Bars 1 and 2 are confirmation: price up, delta strongly positive, CVD at a high of +1,970. Bar 3 pulls back with sellers in control. Bar 4 closes at a new high, 5.75 points above bar 2, but on a delta of only +310: CVD reaches +1,550, well below its +1,970 peak. That is the divergence. Price got higher with less than a third of the aggressive buying bar 2 needed.
On the footprint, the high of bar 4 is where you look. If the top rows show buying into the ask that stalls (positive delta per price at the high, no progress), it fits a passive seller absorbing the push. Bar 5 then confirms: negative delta, a close back below bar 3, and CVD falling to +910.
Where delta misleads
Delta is a count of aggression, not a measure of direction, and it has four common traps.
- Delta is not direction. A bar can close up on negative delta. Positive delta tells you buyers were aggressive, not that they were right.
- Passive orders move price too. Price rises when offers are pulled or when bids step up, even with sellers hitting the bid. Large passive buyers can lift the market on negative delta. That is why you read delta with the book or a heatmap, not alone.
- Session reset. CVD resets at a start point you choose: the Globex open, the cash open, or a custom time. The same day gives different CVD lines depending on that setting. Pick one and keep it.
- Rollover. During roll week, volume moves from the expiring contract to the next one. A CVD on the old contract fades for reasons that have nothing to do with buyers or sellers, and a continuous chart can show a jump at the switch. Make sure you are reading the contract that holds the volume.
Using it on an entry with a defined stop
Delta and CVD work best as a filter on a level you already planned, with the stop set by price, not by the indicator. In the example above, a short would only make sense after bar 5 confirms. Say the high of bar 4 was 21,072.00: the stop goes a tick above it, at 21,072.25, and the entry is the bar 5 close at 21,045.25.
That is 27 points of risk, 108 ticks. On one NQ at 5 dollars a tick, that is 540 dollars. Take a hypothetical 50K evaluation with a 2,000 dollar drawdown: one NQ risks more than a quarter of the room on a single idea. Three MNQ at 0.50 dollar a tick risk 162 dollars, which leaves room for a string of losers. The position size calculator does this sum for any stop and instrument, and how to pass a futures prop firm evaluation explains why the size matters more than the setup.
If price takes the stop, the divergence was wrong, and that happens often. The point of a defined stop is that being wrong costs a known amount.
To see these readings on live MBO data, the footprint and CVD tools are where to start, on a platform your prop firm feed can connect to.
Firms that run DeepCharts