Gamma Bands and Expected Move: frame the session
Zero Gamma tells you whether to fade or follow, the expected range tells you how far price can go: where to find both, the settings that matter, and an ES session.
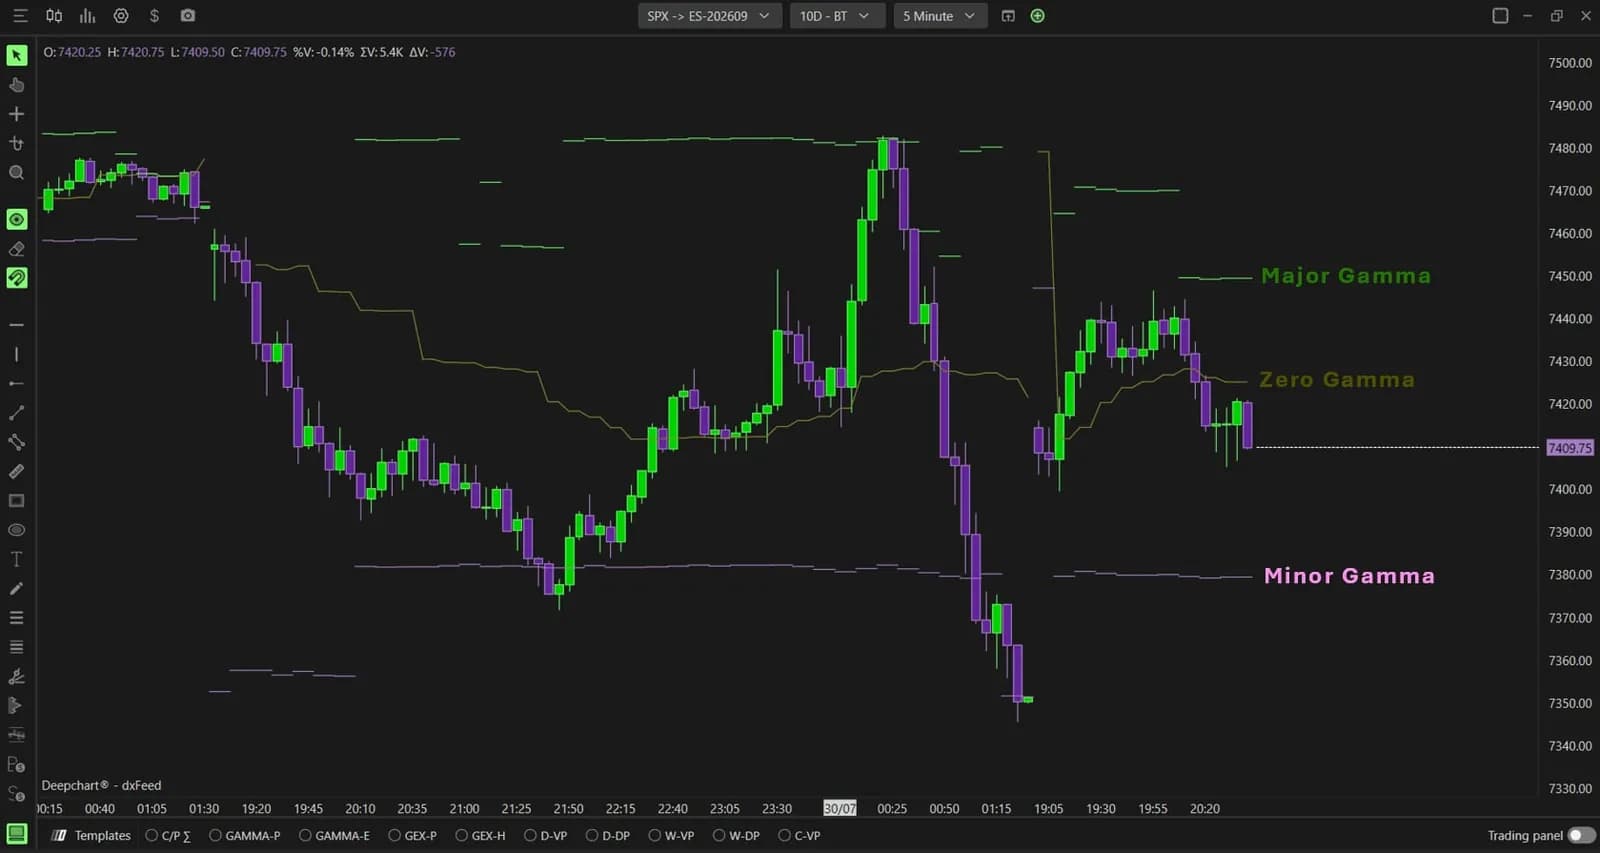
Before the first trade of the day, an order-flow trader needs two answers the footprint cannot give: what kind of session this is likely to be, and how far price can reasonably travel. DeepGammaOFF answers both from the options market. Gamma Bands draw the line where dealer hedging flips from braking the move to feeding it, and Expected Move draws the range the options market has priced for the session.
Neither tool tells you where to enter. They set the frame: fade the edges or follow the break, how far a target can reach, how much room a stop needs. The order flow decides each trade inside it.
What Gamma Bands and Expected Move show
Gamma Bands show where dealer hedging changes nature, and Expected Move shows how big a move the options market considers normal for the day. The first is about regime, the second about size.
Gamma Bands plot three levels derived from gamma exposure. Zero Gamma is the price where dealer exposure flips from positive to negative. Major Gamma marks the strongest hedging concentration above price, and Minor Gamma the secondary one. Expected Move converts option implied volatility into a shaded band around price, with an upper and a lower boundary.
If gamma exposure is new to you, start with GEX for futures traders: it explains why options hedging on SPX and NDX reaches ES and NQ. The strike-by-strike view behind these lines is covered in GEX Profile and GEX Heatmap.
Where to find them in the platform
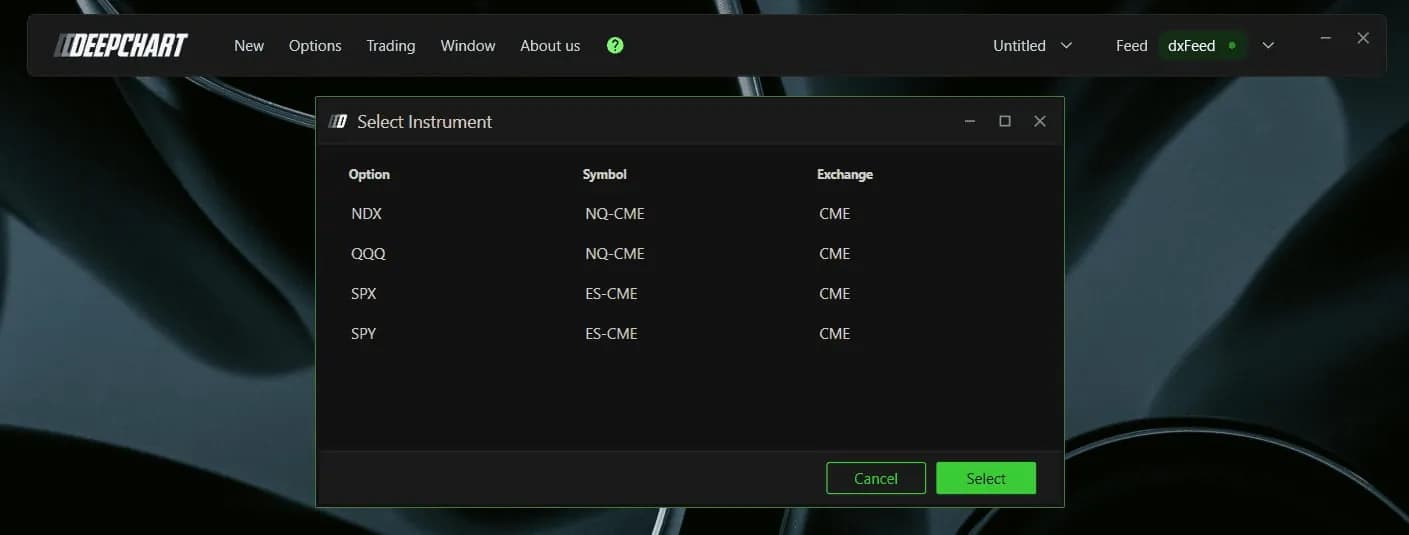
Both indicators live on an option chart, opened through New then Option Chart, on NDX, QQQ, SPX or SPY. They are option indicators, so they do not appear on an ordinary futures chart, but unlike the GEX Heatmap they are not limited to SPX. The charts in the screenshots read SPX levels projected onto the ES contract, which is exactly how a futures trader uses them.
One naming detail saves time. In Indicator Add, Gamma Bands are listed as Option Envelopes, and their settings window is titled Option Levels/Envelopes. Expected Move is listed as Option Expected Move. Search for those names, add each indicator with the plus, then open its settings icon.
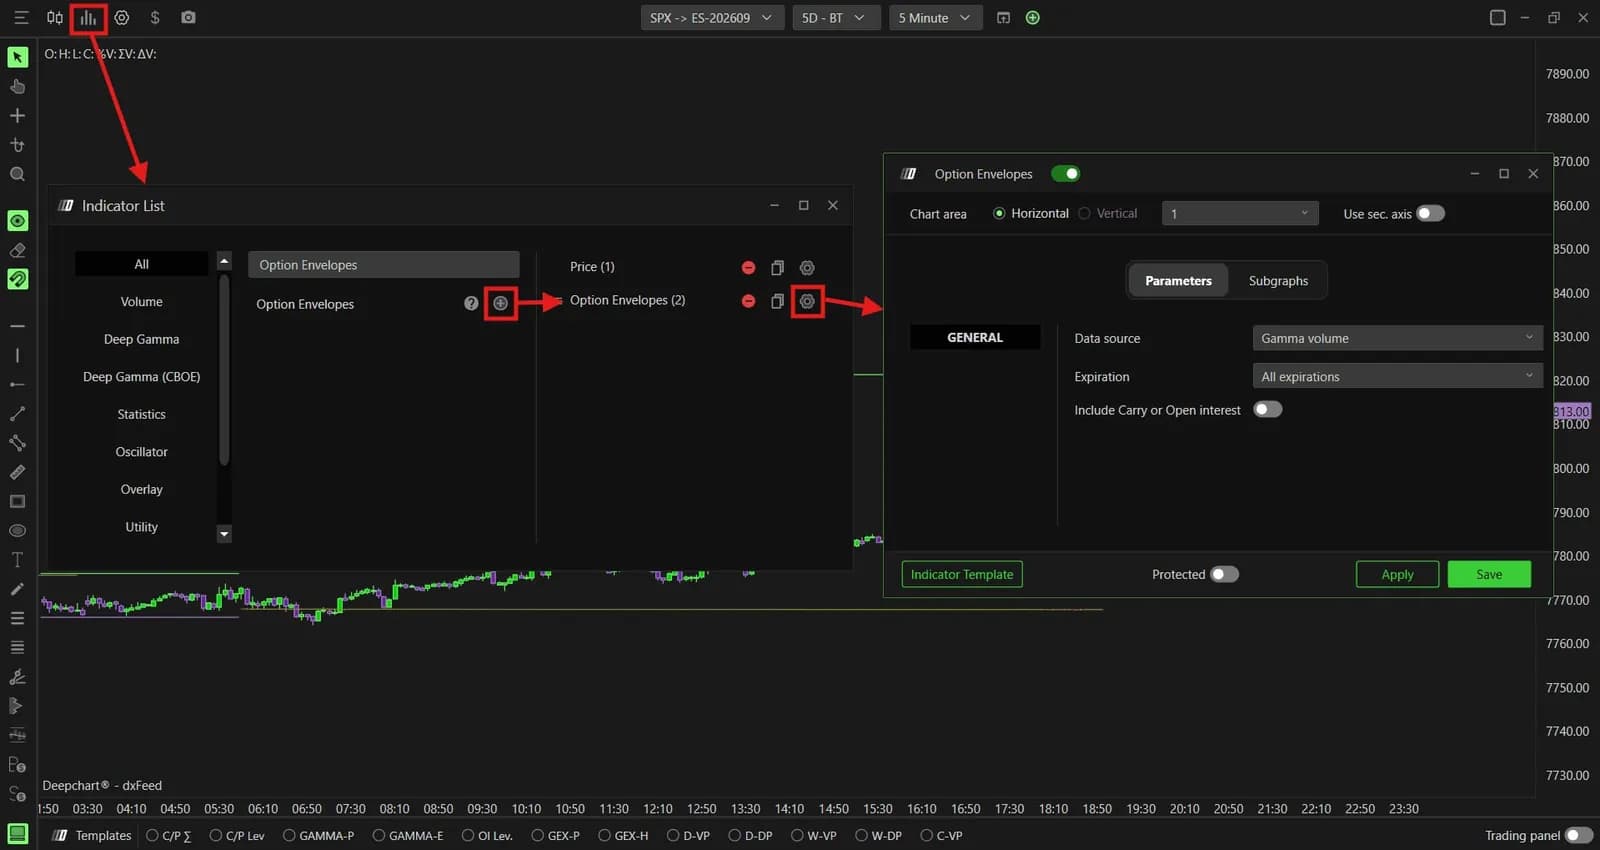
Gamma Bands: one regime line, two hedging levels
Zero Gamma is the line that matters most, because it separates a market where dealer hedging absorbs moves from one where it amplifies them. Above it, dealers tend to sell into strength and buy into weakness, which favors ranges and pinning. Below it, their hedging runs with the move, which favors trend days and wider swings.
Read Zero Gamma as a switch for your strategy, not as support or resistance. Price can trade straight through it; what changes is the behavior to expect next.
Major Gamma and Minor Gamma are the places where hedging is most concentrated. They are drawn as BrokerLines by default, extended to the right edge of the chart with a price label, like an order line, so they stay visible as session references even when price moves away.
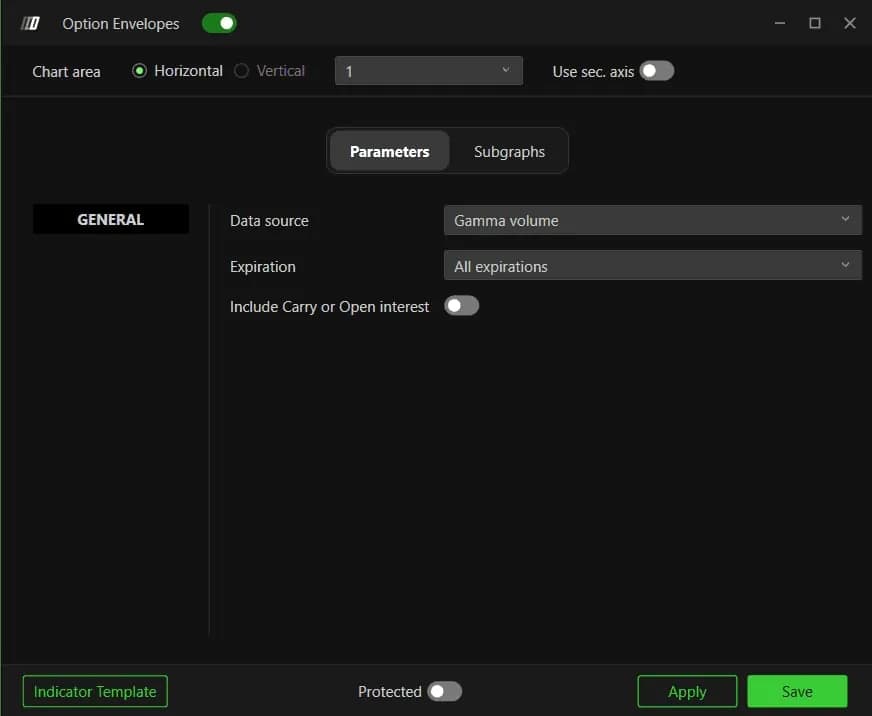
The Parameters tab holds the only three settings that change the levels themselves. Data source decides what the levels are computed on, Expiration decides which options count, and Include Carry or Open interest adds open interest carried over from previous sessions.
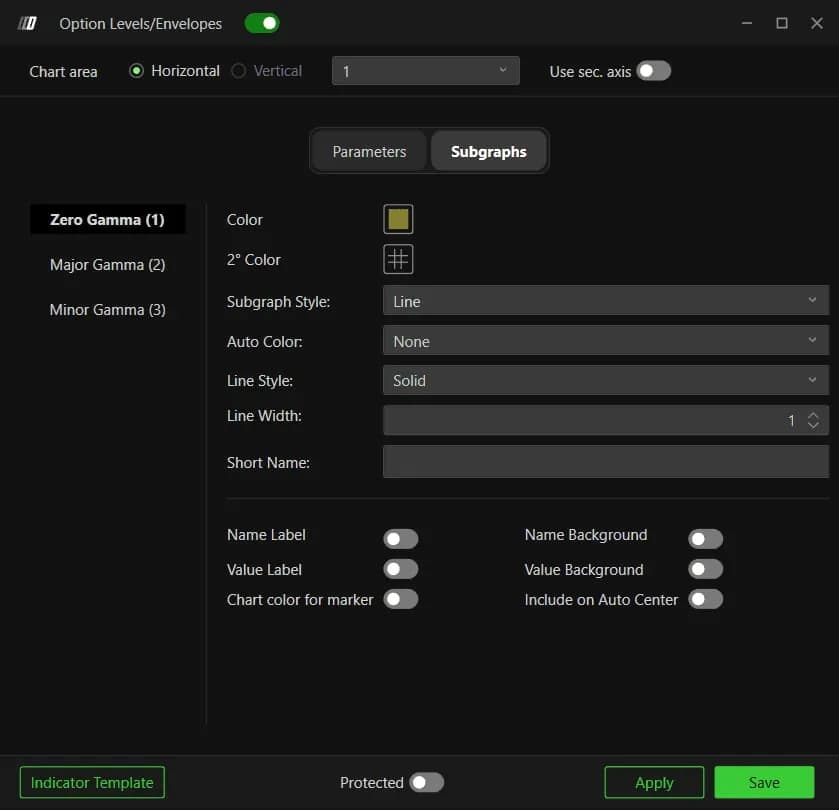
The Subgraphs tab is presentation only. Zero Gamma is drawn in gold, Major Gamma in green and Minor Gamma in purple, each with the usual color, style, width and label switches.
Expected Move: the session range the options market paid for
Expected Move turns implied volatility into a price band, the distance the market currently treats as a normal move for the session. It is an order of magnitude, not a direction call and not a forecast of the path.
Two settings decide what you read. Interval is Daily by default, so the band covers the whole session and frames the day; Thirty minute recomputes on a rolling window and gives far more mobile intraday targets. Value is One standard deviation by default, roughly a seven-in-ten chance that the session closes inside the band. Two standard deviation widens it to roughly 95%, and Average uses plain mean implied volatility.
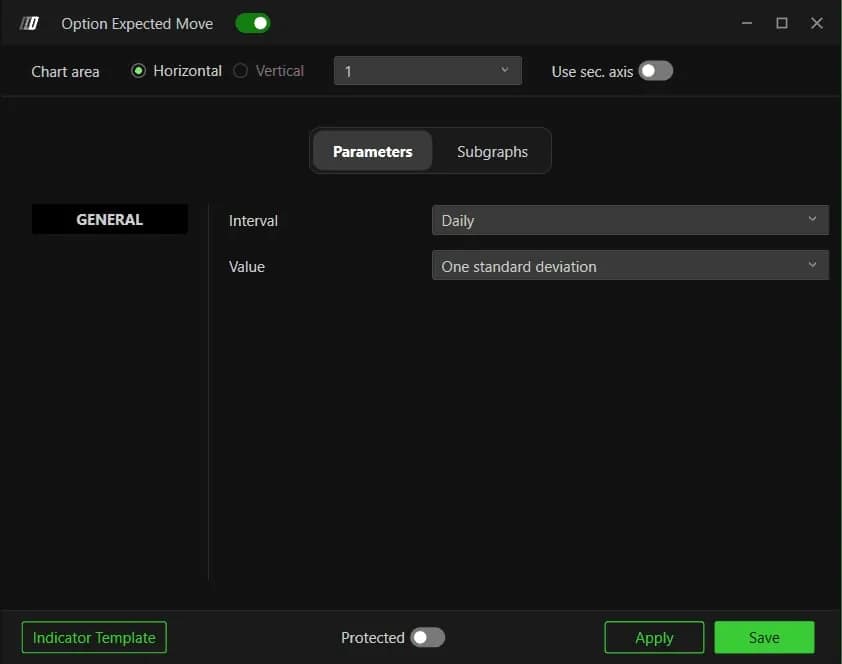
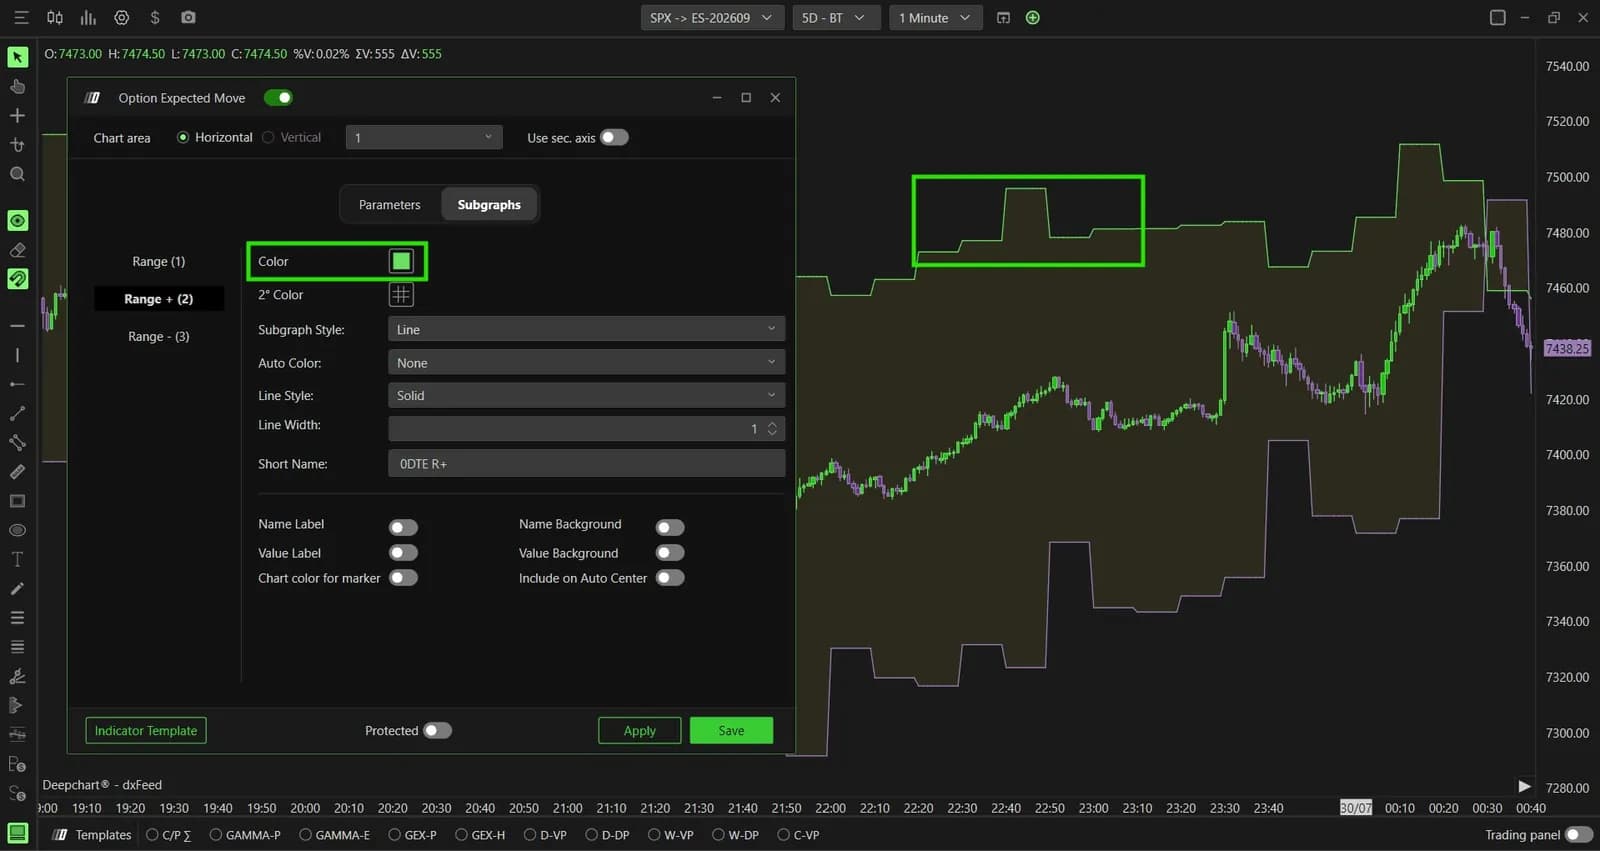
The shaded band appears as soon as the indicator loads, but its two boundary lines do not. Range + and Range - ship with their Subgraph Style on Hidden. Switch them to Line, or to BrokerLine for a labeled stroke to the right edge, and the band becomes a readable pair of prices.
Reading both in a real session
The two tools work as a pair: Gamma Bands tell you which playbook to open, Expected Move tells you how far that playbook can reach. Take a hypothetical ES session. The daily band runs from 7,410 to 7,490, Zero Gamma sits at 7,430 and Major Gamma at 7,480, and the US open finds price at 7,452, above Zero Gamma.
That is a positive-gamma morning: expect rotations. Price pushes into the 7,480 to 7,490 zone, between Major Gamma and the top of the band. The footprint shows heavy buying that no longer moves price. That is the trade: a fade toward the middle of the range, with a modest target, because the regime favors mean reversion.
Now change the afternoon. A data surprise sends price through 7,430 with sellers hitting the bid bar after bar. Below Zero Gamma, dealer hedging adds to the selling. The playbook flips to trend: stop fading, look for pullbacks to sell, and let the lower boundary at 7,410 act as the first target rather than a wall. A close outside the band invalidates nothing; it says the session moved more than the market had paid for.
The same reading applies to NQ with NDX or QQQ levels. On a quiet day the band is narrow and a 60-point ES target is out of proportion. On a CPI or FOMC day it widens, and yesterday's tight stop sits inside the noise.
The settings that matter
A handful of settings change what the two indicators compute; the rest is color and labels. Keep the defaults below until you have watched the levels over several weeks.
| Setting | Default | What it changes |
|---|---|---|
| Data source (Gamma Bands) | Gamma volume | Levels weighted by each strike's gamma. Call put reads raw activity, Open interest eod gives stable levels one session behind |
| Expiration (Gamma Bands) | All expirations | Tighten to 0 DTE or one week for levels closer to the day's hedging, at the cost of more movement |
| Include Carry or Open interest | Off | Adds open interest carried from earlier sessions |
| Interval (Expected Move) | Daily | Thirty minute recomputes on a rolling window for intraday targets |
| Value (Expected Move) | One standard deviation | Two standard deviation widens the band; Average uses mean implied volatility |
| Range + and Range - | Hidden | Switch to Line or BrokerLine to see the boundaries |
| Include on Auto Center | Off | Leave it off, or the chart rescales around the lines |
How they help on a prop firm evaluation
On an evaluation, these tools earn their place by sizing, not by signaling. The expected range tells you whether a target is realistic and whether your usual stop fits the day. When the band is wide, a tighter stop is not safer: it is more likely to be hit by noise. The answer is fewer contracts with the right stop, which is the method in how many contracts to trade on a prop firm account.
The regime line adds a second filter. Below Zero Gamma, ranges are wider and moves run further, so the daily loss limit can be reached faster than on a pinned morning. Knowing that before the open is the moment to cut size, not after the second loss. Which plan includes DeepGammaOFF, and what the data costs, is on our platform page.
Firms that run DeepCharts