GEX Profile and GEX Heatmap: dealer gamma, explained
Strike by strike, block by block, bar by bar: how the three Cboe-based DeepGamma indicators show where gamma sits and which regime the ES session is in.
Gamma exposure is easy to explain and hard to use live: a number in a morning newsletter does not tell you which strike matters at 10:15, or whether the regime has flipped since the open. DeepGammaOFF answers that with three indicators that draw dealer gamma on the chart itself. The GEX Profile shows it strike by strike in a panel on the right, the GEX Heatmap paints it onto price as colored blocks, and Option Summary Gex reduces it to one value per bar in an oscillator below the candles.
All three read the participant data Cboe publishes for SPX options, which identifies real market maker executions instead of assuming who holds what. That is their strength, and it sets their scope: they run on an SPX option chart, which carries the ES futures price, so they speak directly to ES and MES traders.
What the three indicators show
Each indicator answers a different question about the same data: where gamma sits, how strong it is at each price, and which regime the session is in. If the concept itself is new to you, start with GEX for futures traders and the short glossary entry on GEX, then come back here for the tools.
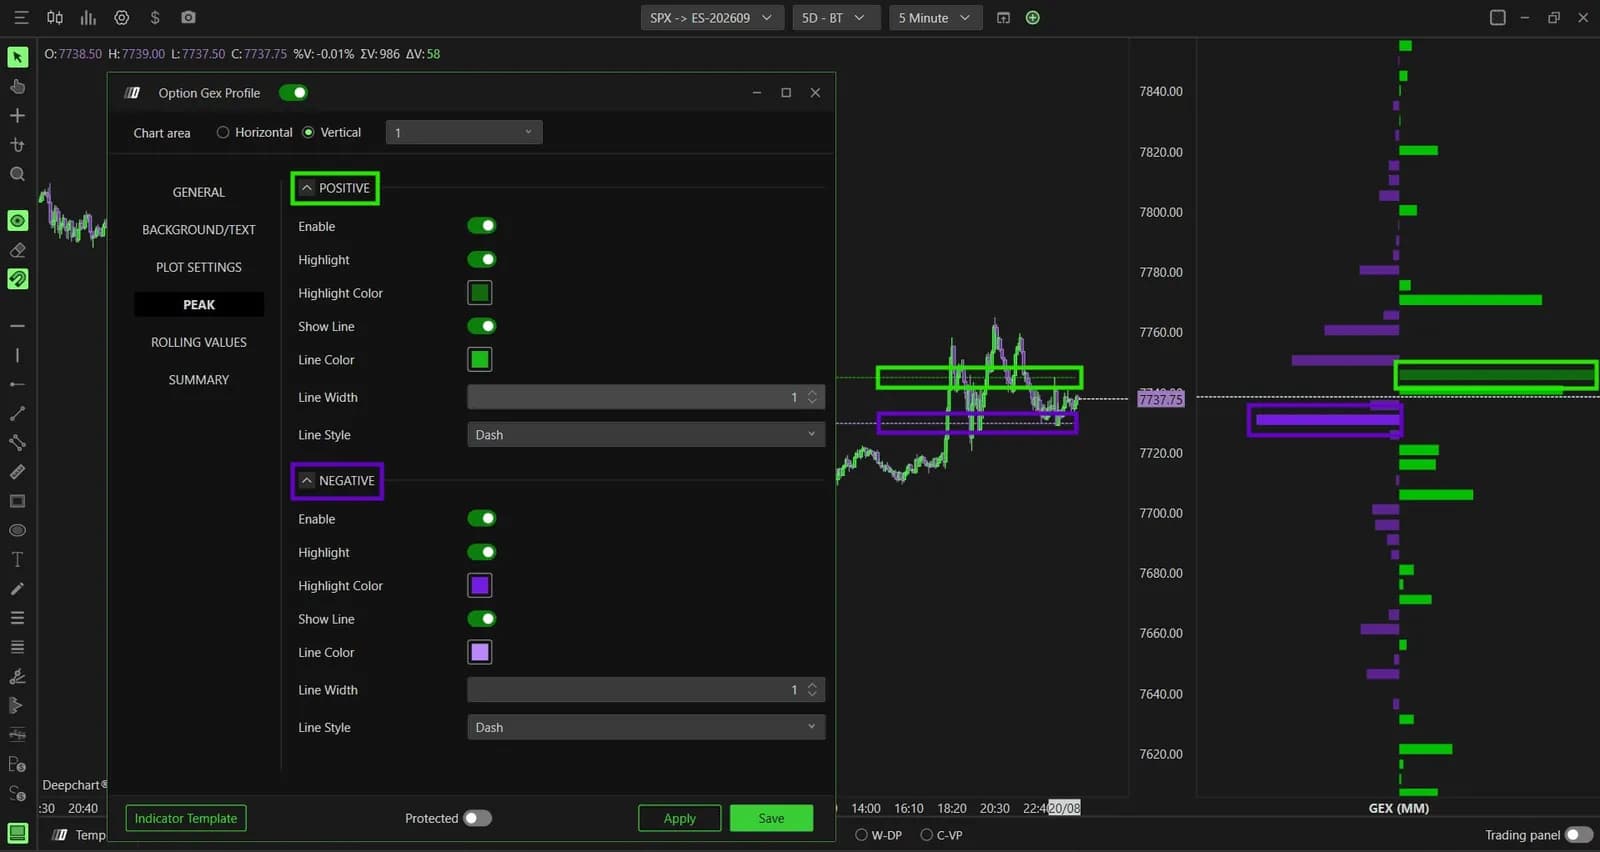
- GEX Profile: a vertical histogram pinned to the right edge of the chart, one bar per strike. Green marks positive gamma, purple negative gamma, and the two most loaded strikes get a dashed line across the chart.
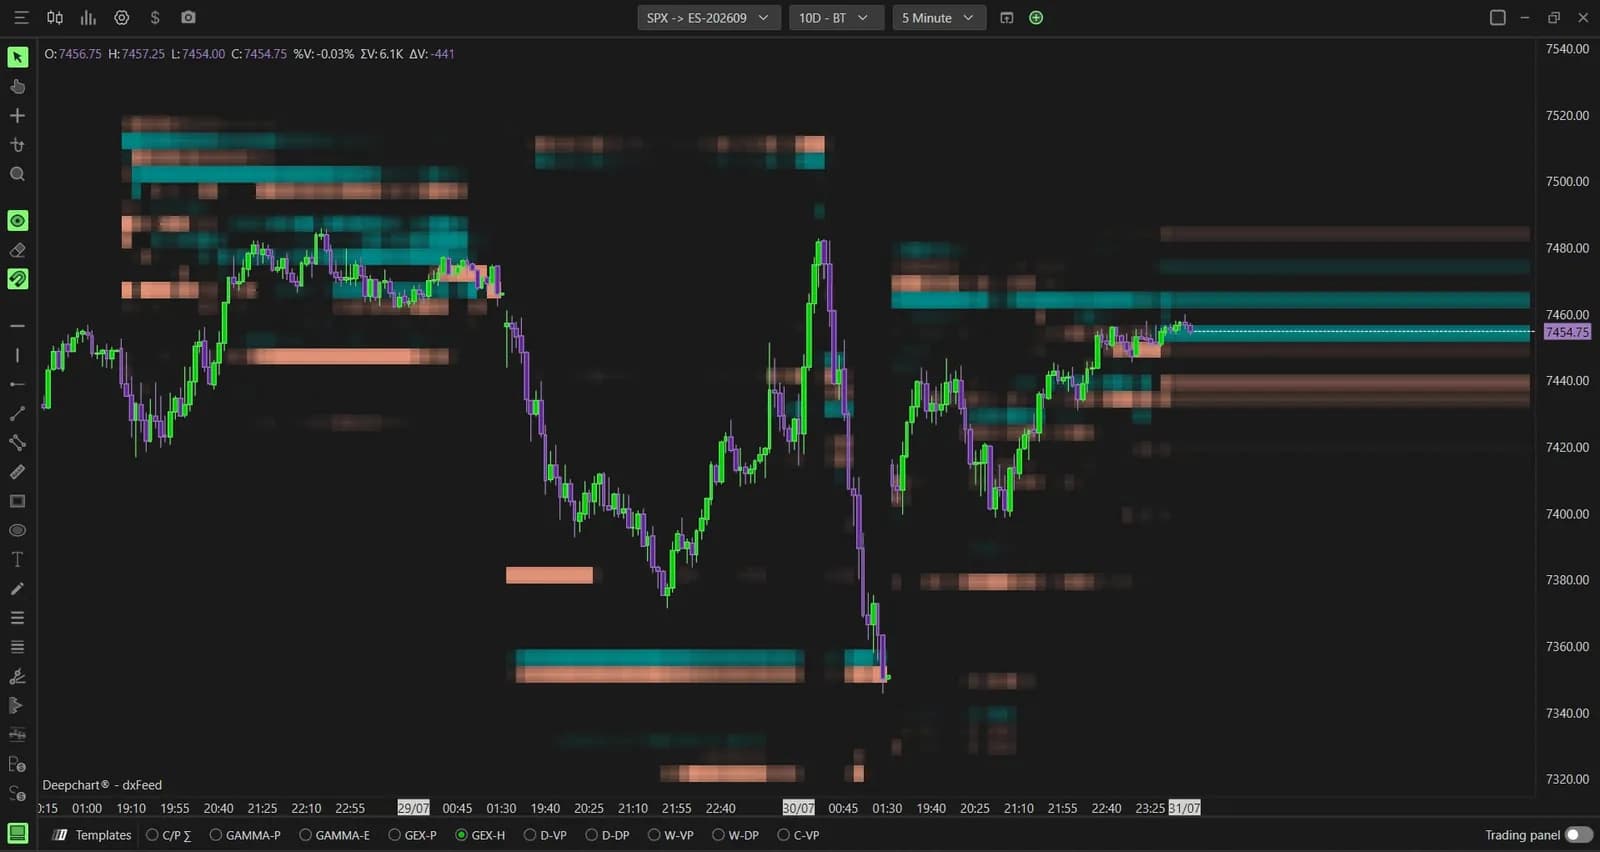
- GEX Heatmap: horizontal blocks laid on price. Cyan means dealers are long gamma there and their hedging dampens moves; orange means they are short gamma and their hedging amplifies them. The wider and brighter the block, the larger the exposure.
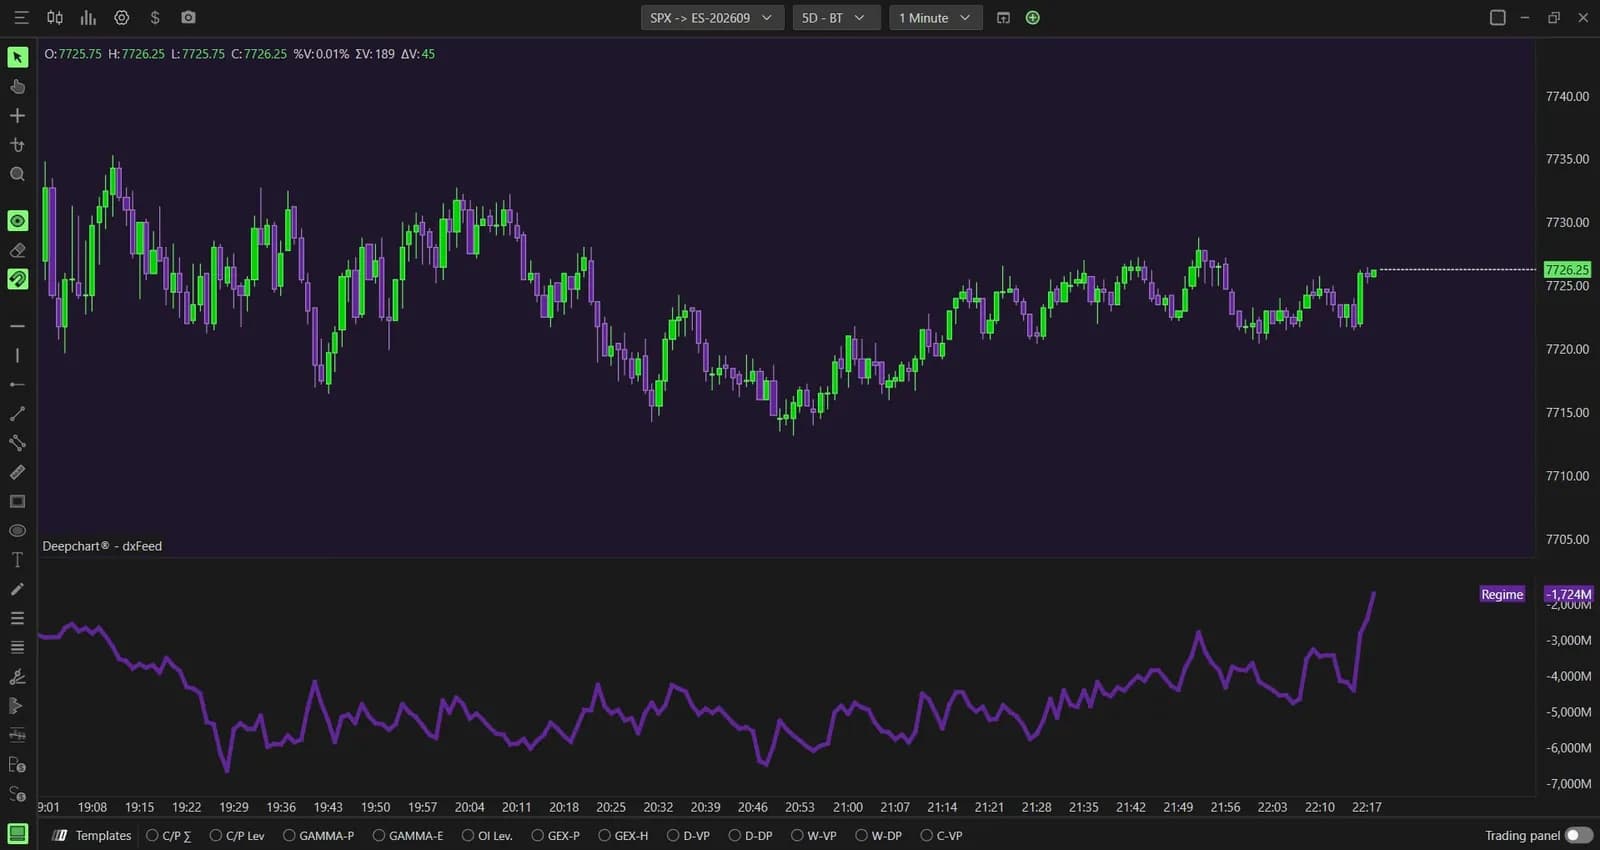
- Option Summary Gex: the session's net GEX, netted across every strike, drawn bar after bar in its own pane. Green above zero, purple below.
Opening the right chart
Every one of these indicators lives on an SPX option chart, opened from New, then Option Chart, then the SPX row with symbol ES-CME on exchange CME. On a plain ES or NQ futures chart they will not appear, and no setting changes that: the data they need only exists for SPX options. The rest of the DeepGammaOFF range covers other option symbols with OPRA data and a proprietary formula, but these three are the Cboe-based ones.
Once the chart is open, the Templates bar at the bottom is the fast route. GEX-P loads the profile with your last settings, GEX-H loads the heatmap, and a right click on either tab opens its settings directly. Option Summary Gex is added from Indicator Add, in the Deep Gamma (CBOE) category, and draws in a separate pane. If the platform itself is still new, our getting-started guide covers installation and the data feed first.
Setting up the GEX Profile
The GEX Profile has one setting that changes what you read, Data source, and everything else only changes how it looks. Keep Gex (Market Maker), the default: it is net dealer gamma exposure as Cboe reports it. Gex (Market Maker C/P) uses the same data split into a call column and a put column around a center line, which makes the two sides easy to compare. Dex (Market Maker) is a different question altogether, directional delta exposure rather than gamma, so treat it as a second view, not a variant.
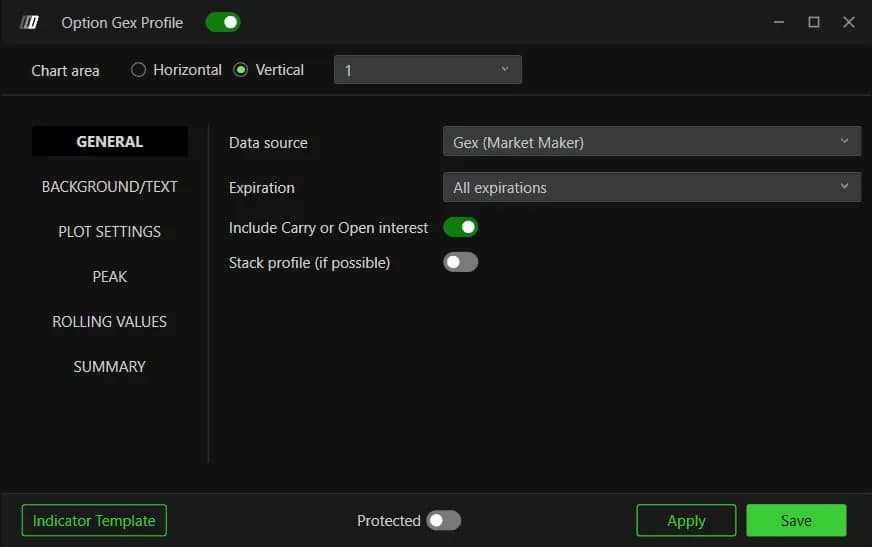
The Peak tab is what makes the profile readable at a glance. Show Line is already on for both sides, so you get a green dashed line at the strike with the largest positive GEX and a purple one at the largest negative GEX without touching anything. Turn Highlight on if you also want the matching bar colored.
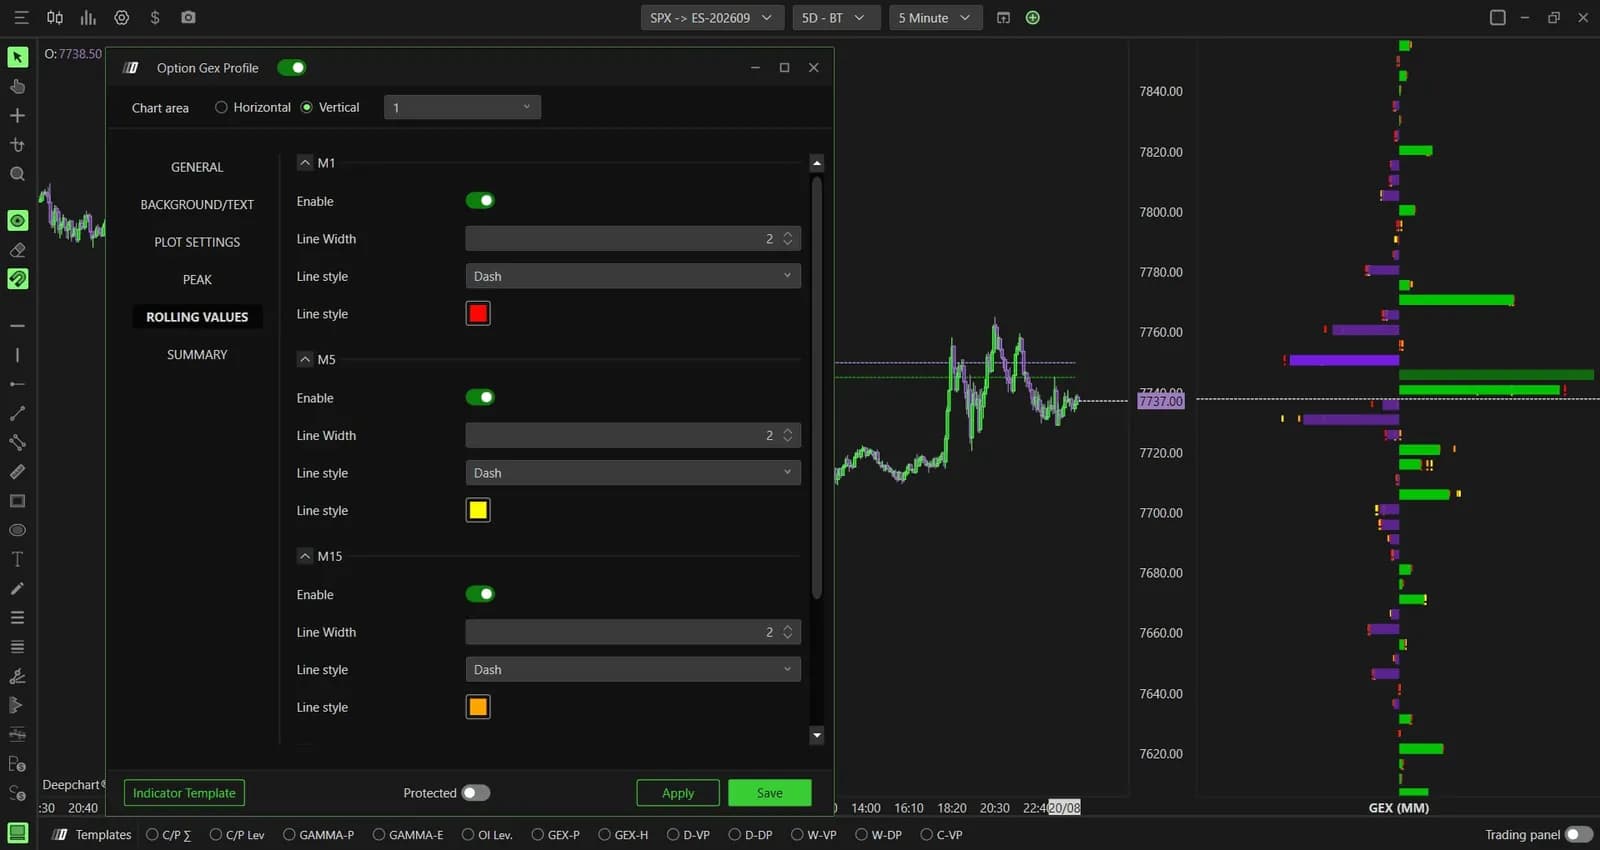
Rolling Values redraws the profile as it stood 1, 5, 15 and 30 minutes earlier, as lines over the live bars. It is the way to see positioning build or unwind during the session. All four are off by default; switch on the one that matches your trade horizon rather than all four at once.
| Setting | Default | What it changes |
|---|---|---|
| Data source | Gex (Market Maker) | Which exposure is read: keep it unless you have a specific question |
| Expiration | All expirations | Narrow it to short expirations to keep only same-day hedging |
| Include Carry or Open interest | On | Adds open interest carried from earlier sessions |
| Peak, Show Line | On, both sides | Dashed line at the most loaded call and put strikes |
| Rolling Values M1 to M30 | Off | Lines showing the profile 1, 5, 15 or 30 minutes ago |
| Number of profile | 5 | How many sessions are drawn at once |
Reading the GEX Heatmap
The heatmap is read by color first and settings second: cyan blocks are zones where dealer hedging tends to slow price, orange blocks are zones where it tends to speed it up. On the screenshot below, the blocks stretch across three sessions, so you see which levels kept their exposure and which faded. That is the whole use of the tool: knowing in advance which levels are likely to cushion a move and which are likely to let it run.
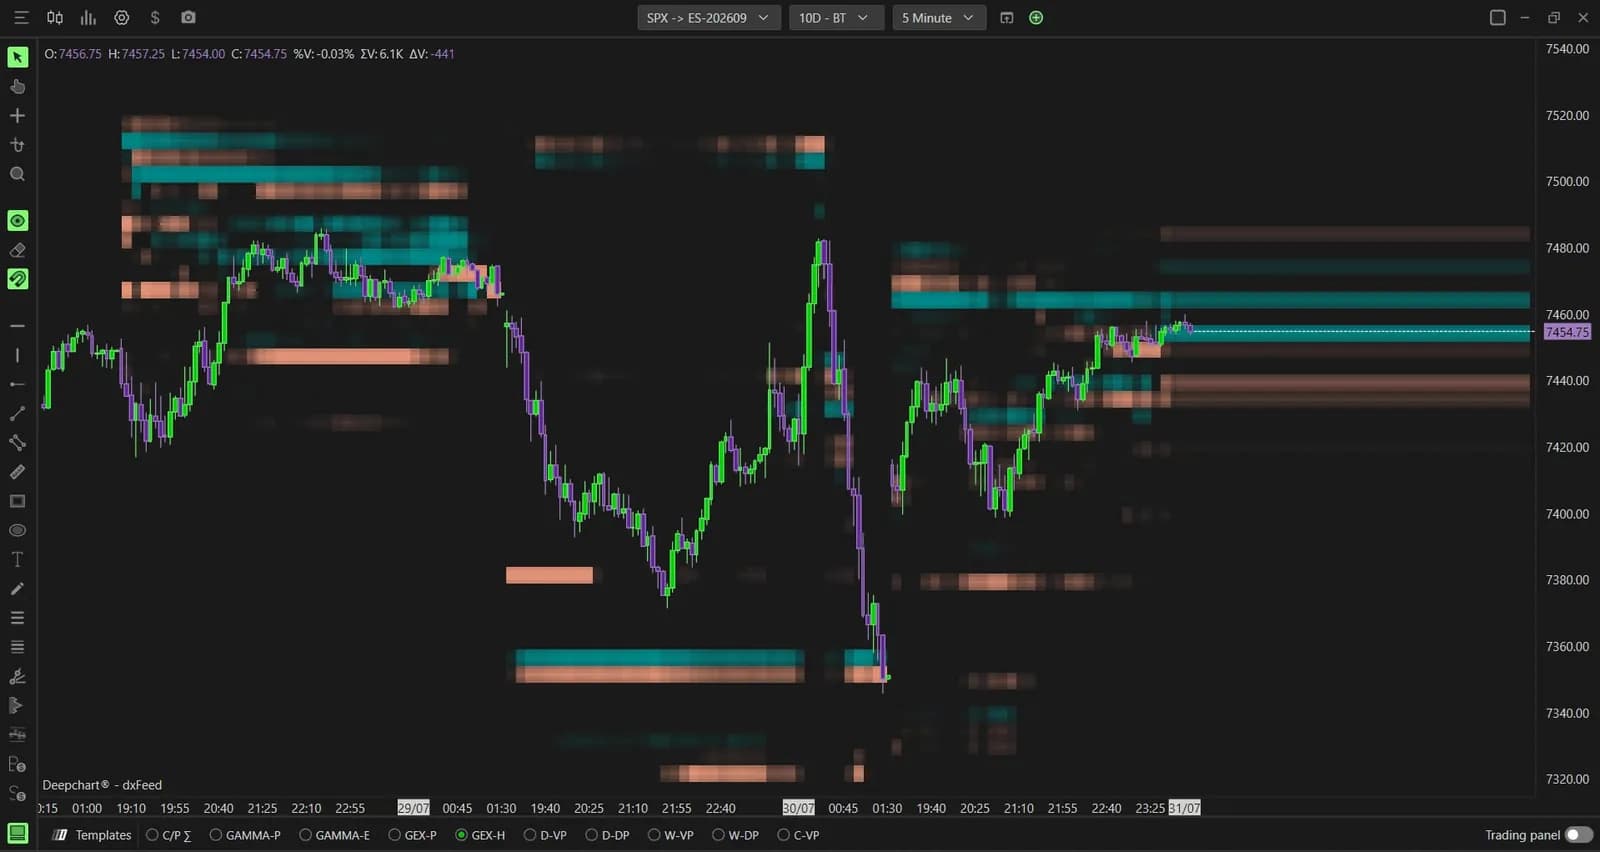
Two settings in the General tab decide which data feeds the blocks. Option expiration type starts on 0 DTE, options expiring that day, whose hedging weighs most on the session. Include Carry or Open Interest starts off. If you widen them, widen one at a time: opening every expiration and adding carry together changes the map completely, and you lose track of what moved it.
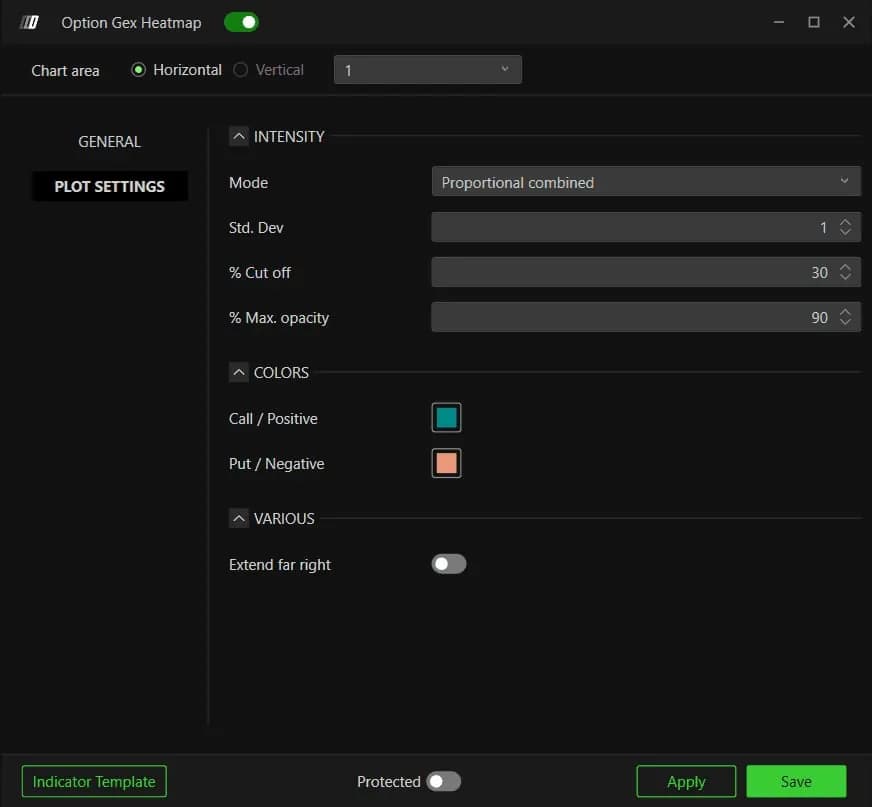
In Plot Settings, the Intensity section sets readability. Mode is Proportional combined, the value DeepChartsOFF recommends, which weighs the current session and the same time of day in earlier sessions half and half. % Cut off, at 30, is the threshold below which a block is not drawn. It is the density dial: raise it on a heavy session until only the loaded zones remain, lower it when the map looks empty.
Option Summary Gex: the regime in one line
Option Summary Gex tells you, bar by bar, whether the session sits in positive or negative gamma. The Regime series prints green bars above zero and purple bars below, with the current value on the right scale. In positive gamma, price action tends to compress; in negative gamma, moves tend to be wider and more directional. It is a filter for how to trade, not a signal for which way.
The Marker section adds background bands on the price chart itself, green or purple by regime, at an opacity of 20 so the candles stay readable. Value sets the threshold where the color flips, zero by default, which means the band changes exactly when net GEX changes sign.
Using it on an evaluation
On a prop firm evaluation, these indicators help most by telling you which kind of day you are in before you size it. A green regime with price sitting between two strong cyan blocks argues for fading the edges with small targets. A purple regime with orange blocks around price argues for trading with the move, or for trading less, because ranges widen and a stop set for a quiet day gets hit.
The levels describe where hedging may lean on price; the footprint and the book still decide whether it does. Mark the peak strikes and the strongest blocks before the open, then wait for the order flow to confirm at the level. Plans and the DeepGammaOFF license are listed on our platform page.
Prop firms that run DeepCharts