Option Levels and Envelopes Advanced: Cboe ES gamma
Ranked strikes and Zero, Major and Minor Gamma built from Cboe market maker data: what the two Advanced tools add, how to set them up and read them at the open.
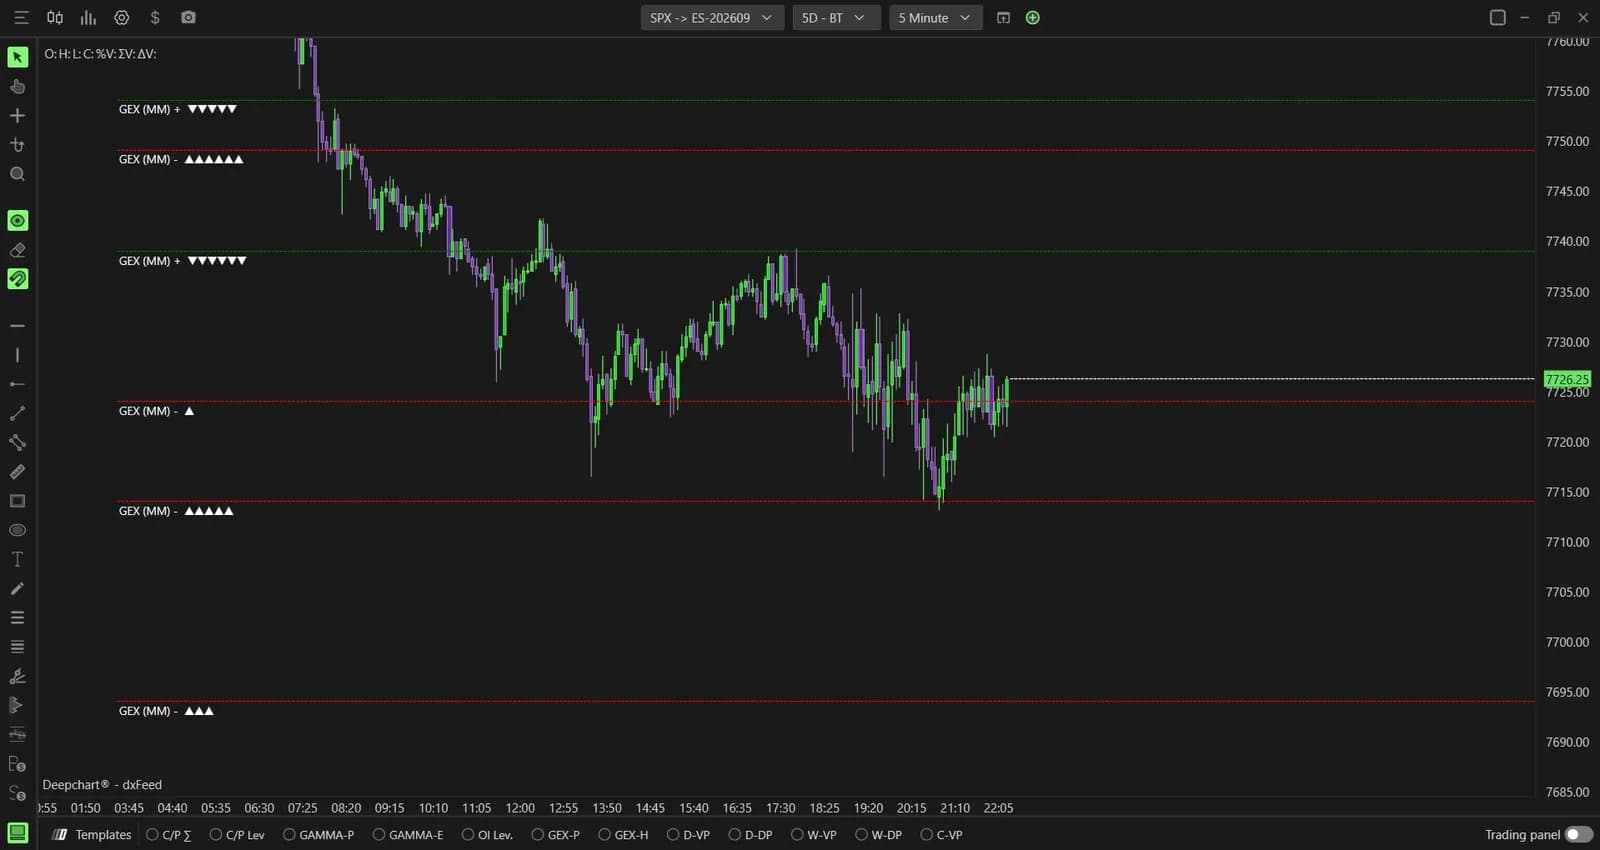
Most gamma levels on a futures chart are estimates. They are built from option volume or from assumptions about who sold what, and they drift furthest from reality on the days that matter most, around 0DTE flows and monthly expiration. DeepGammaOFF Advanced takes another route. Its two flagship indicators, Option Levels Advanced and Option Envelopes Advanced, read the participant data Cboe publishes for SPX options, so the lines on your ES chart describe where market makers actually carry exposure.
The two tools answer different questions. Option Levels Advanced ranks the strikes that matter most and draws them on price. Option Envelopes Advanced draws the three gamma lines, Zero, Major and Minor, recomputed through the session from real-time open interest. This guide covers what each one shows, how to set it up, and how to read both at the US open.
What the Advanced versions add
The Advanced versions replace estimated positioning with market maker data reported by Cboe. The standard Option Levels and Option Envelopes infer exposure from volume or gamma assumptions. The Advanced pair starts from the participant split Cboe publishes, which tells the platform which side of each trade dealers were on. That is why they live in their own category, Deep Gamma (CBOE), in the indicator list.
The data only exists for SPX options, so both indicators work on SPX alone. The levels are projected onto the ES futures price, which makes them just as valid on MES in a prop firm account. If you trade NQ or MNQ, the standard versions on an NDX or QQQ chart are the ones to use, and the concepts behind them are covered in gamma bands and expected move.
Start from an SPX option chart
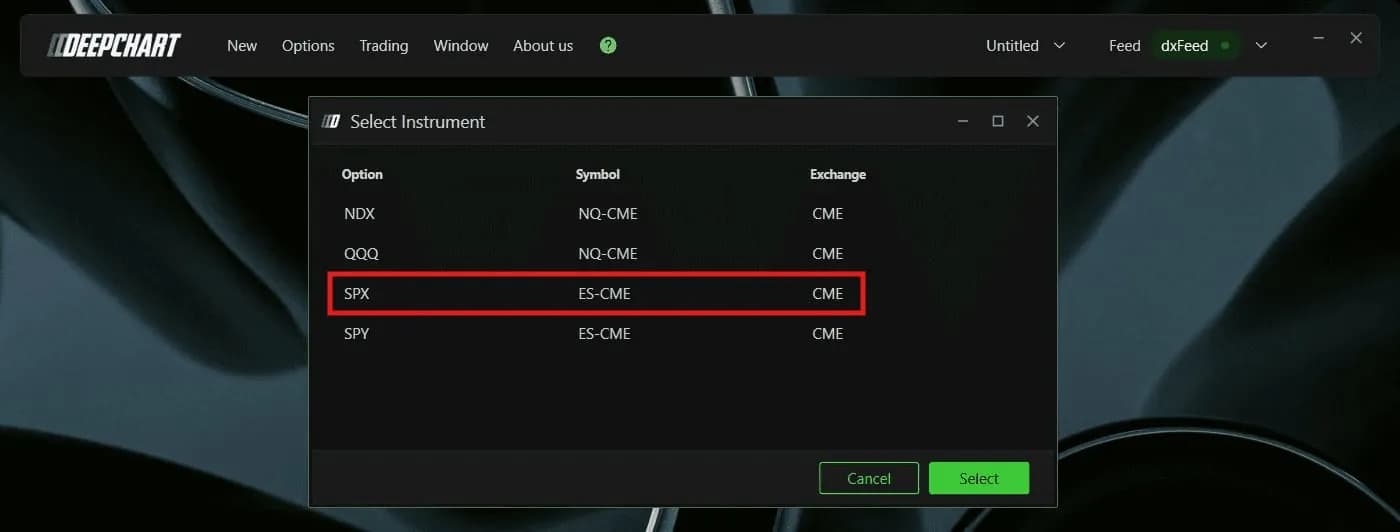
Both indicators need an option chart opened on the SPX row, symbol ES-CME on CME. Go to New, then Option Chart, and pick SPX in the Select Instrument box. The NDX, QQQ and SPY rows are listed too, but the Advanced indicators stay blank on them. Once the chart is open, the title bar reads SPX -> ES with the contract month: you are reading options positioning on the futures price you trade.
You also need an active DeepGammaOFF module, licensed separately from the charting platform. Plans are listed on our platform page.
Option Levels Advanced: the strikes that matter, ranked
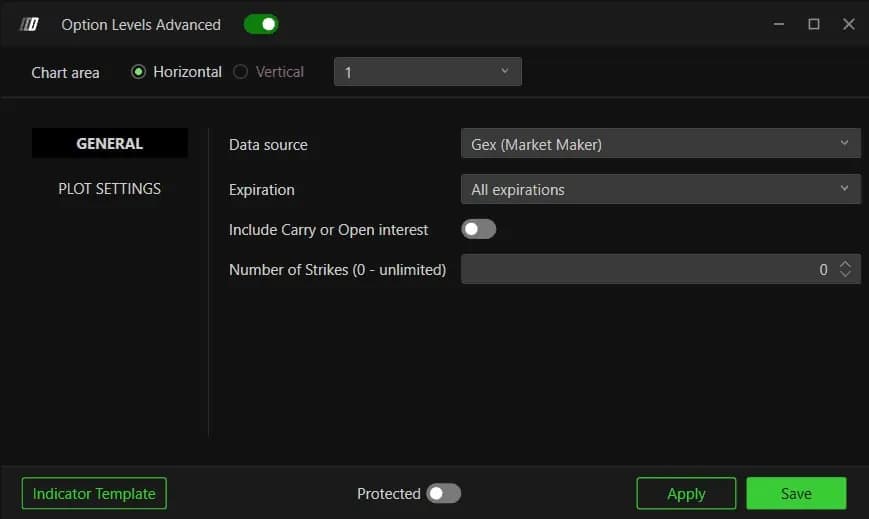
Option Levels Advanced draws the strongest strikes as dashed lines on price and ranks them with triangles. Add it through Indicator Add, then open its settings. The GENERAL tab holds everything that changes the data; the PLOT SETTINGS tab only changes how it looks.
Data source decides what a line means. Gex (Market Maker), the default, is market maker gamma exposure as Cboe reports it, the reference read for hedging pressure. Dex (Market Maker) shows delta exposure instead, so directional hedging. OI (R.T.) uses the open interest the platform computes in real time from the Cboe flow. Market Maker Net Flow isolates dealer buying and selling, and Gamma (Call OI-R - Put OI-R) recomputes gamma on real-time open interest for a structural view.
Each level carries a row of triangles. More triangles means a heavier concentration compared with the other levels on screen. Positive levels are green with triangles pointing down, negative levels red with triangles pointing up. On top of them sits the Zero Gamma line, yellow by default, drawn whatever the number of levels: the single price where dealer gamma flips from positive to negative.

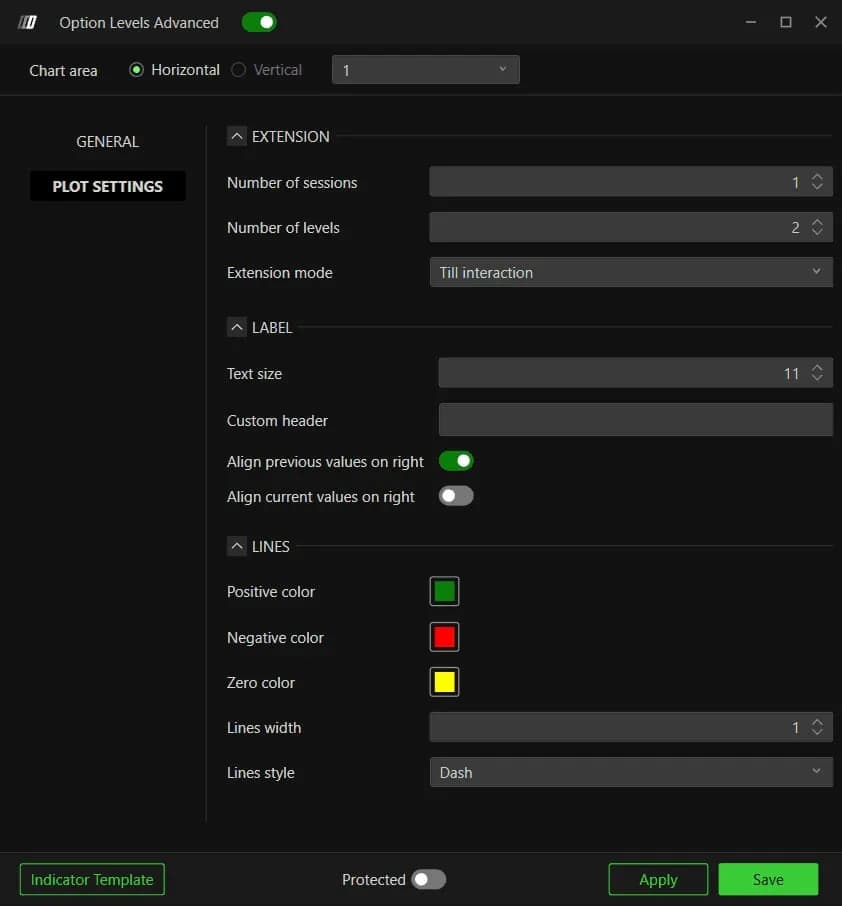
In PLOT SETTINGS, the EXTENSION section controls clutter. Number of levels sets how many strikes are drawn and ranked, Number of sessions how far back they extend, and Extension mode whether a line stops when price touches it.
Option Envelopes Advanced: Zero, Major and Minor Gamma in real time
Option Envelopes Advanced draws the same three lines as Gamma Bands, computed from real-time open interest instead of volume. Official open interest is published once a day. OI-R is the platform's intraday version, rebuilt from the Cboe buy and sell flow, so the lines follow positioning as it changes during the session.
Two data sources are offered. Gamma (Call OI-R - Put OI-R), the default, weights real-time call and put open interest by gamma. OI (R.T.) shows open interest alone, to see where positions sit live. The three lines keep their usual roles: Zero Gamma in gold yellow marks the regime border, Major Gamma in green the heaviest concentration above price, Minor Gamma in purple the secondary one.
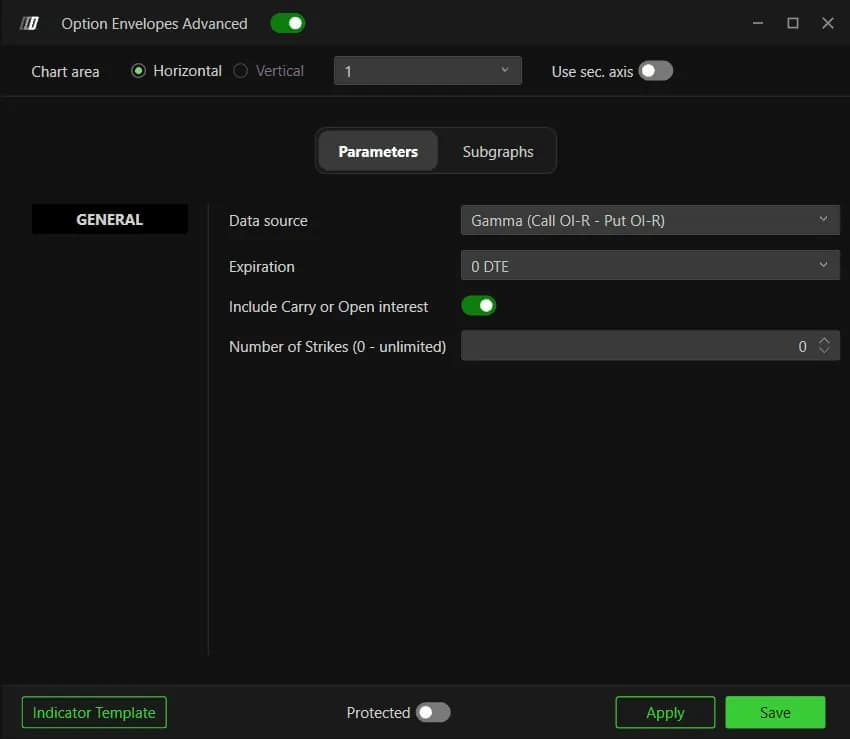
What to check first: the defaults are not those of the standard version. Expiration starts on 0 DTE instead of All expirations, and Include Carry or Open interest is on instead of off. If you run both versions side by side, align these two settings, or the gap you see comes from the settings rather than the data.
| Setting | Default | What it changes |
|---|---|---|
| Data source (Levels) | Gex (Market Maker) | Which exposure the lines represent: gamma, delta, open interest or net flow |
| Expiration (Levels) | All expirations | Narrows to 0 DTE, 1, 7, 31 or 91 days; every label follows it |
| Number of levels | 2 | How many strikes are drawn and ranked by the triangles |
| Extension mode | Till interaction | Line stops when price touches it; None or Till end window otherwise |
| Data source (Envelopes) | Gamma (Call OI-R - Put OI-R) | Gamma-weighted real-time open interest, or OI (R.T.) alone |
| Expiration (Envelopes) | 0 DTE | The day's hedging; widen to All expirations for a broader view |
| Include Carry or Open interest | Off for Levels, on for Envelopes | Adds positions carried from earlier sessions |
Reading both at the US open
Read the regime first, then the levels, then the reaction. Before 9:30 New York time, note where ES sits against the yellow Zero Gamma line. Above it, dealers tend to be long gamma and to dampen moves, so ranges and rotations are more likely. Below it, they tend to be short gamma and to amplify moves, so trends and fast extensions are more likely. The full mechanics are in GEX for futures traders.
Then look at the two ranked strikes from Option Levels Advanced and the green and purple envelopes. Take a hypothetical session: ES opens above Zero Gamma and rallies into a green level with three triangles that also sits near Major Gamma. That is a zone where you expect the push to slow. You do not sell the line. You watch the footprint for absorption or a stall, and only then define a trade with a stop beyond the level.
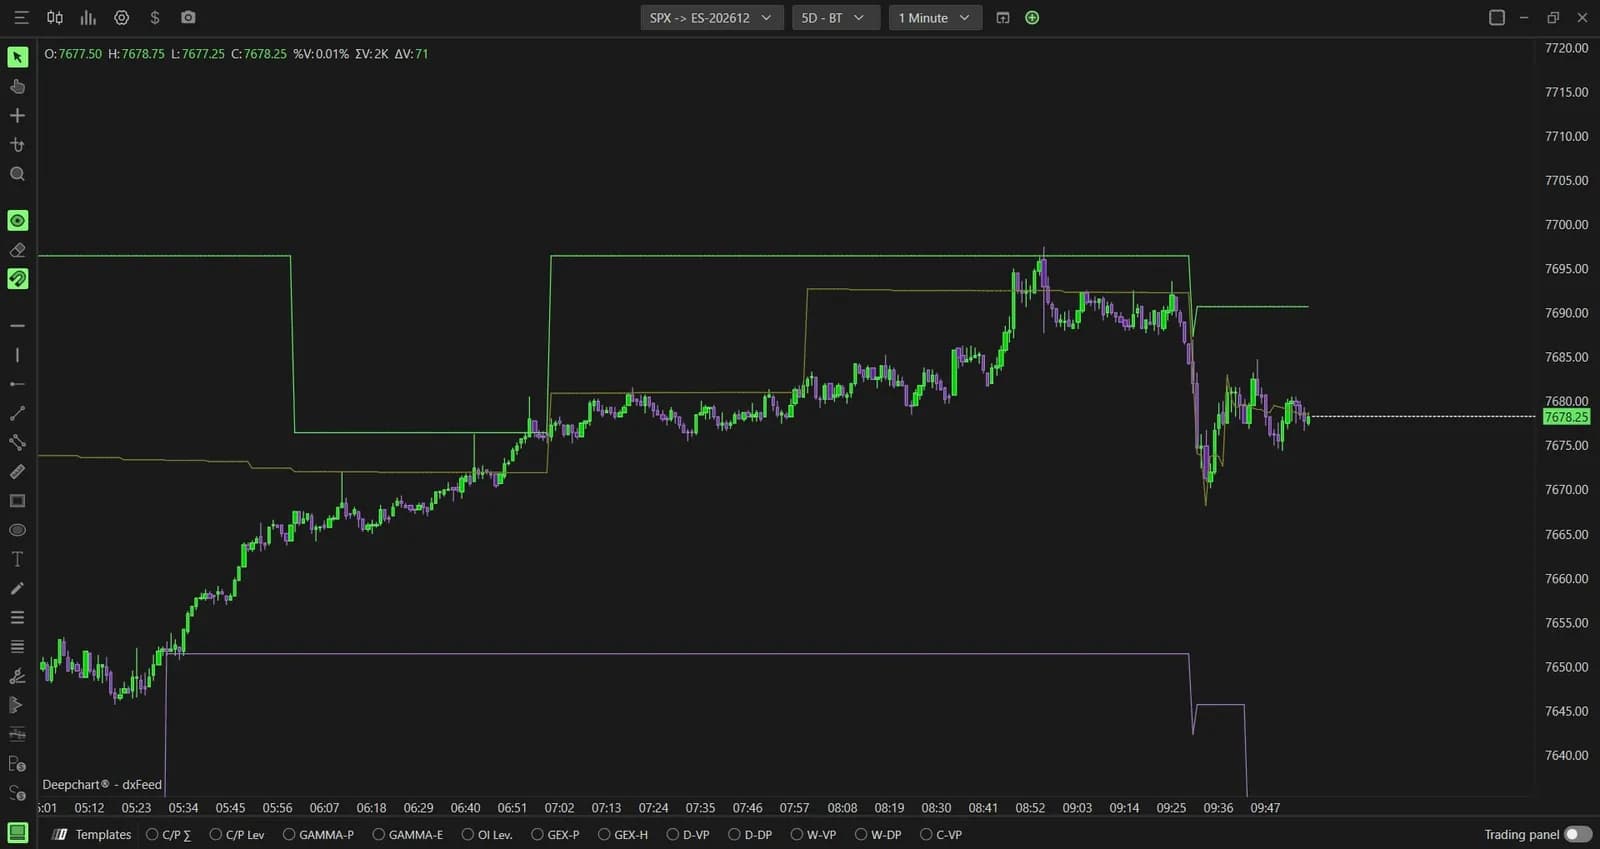
The Advanced envelopes step around as open interest changes, so a level noted at 9:00 can sit elsewhere by noon. Recheck the lines before each new trade instead of trusting a morning screenshot. A useful tip from the help center: keep the standard envelopes on another chart. When the volume-based read and the real positioning read disagree clearly, the disagreement is information in itself.
Building a layered gamma screen
Option Levels Advanced works best as an anchor inside a wider gamma layout. The help center frames each level as a price to react to, confirmed by context. Option Summary gives the regime before you trade a level, the GEX Profile shows how exposure is distributed around it, the GEX Heatmap paints the same exposure as zones on price, and the hedging profile tells you whether dealer flows are likely to amplify or dampen a move there. The profile and the heatmap are covered in GEX Profile and GEX Heatmap.
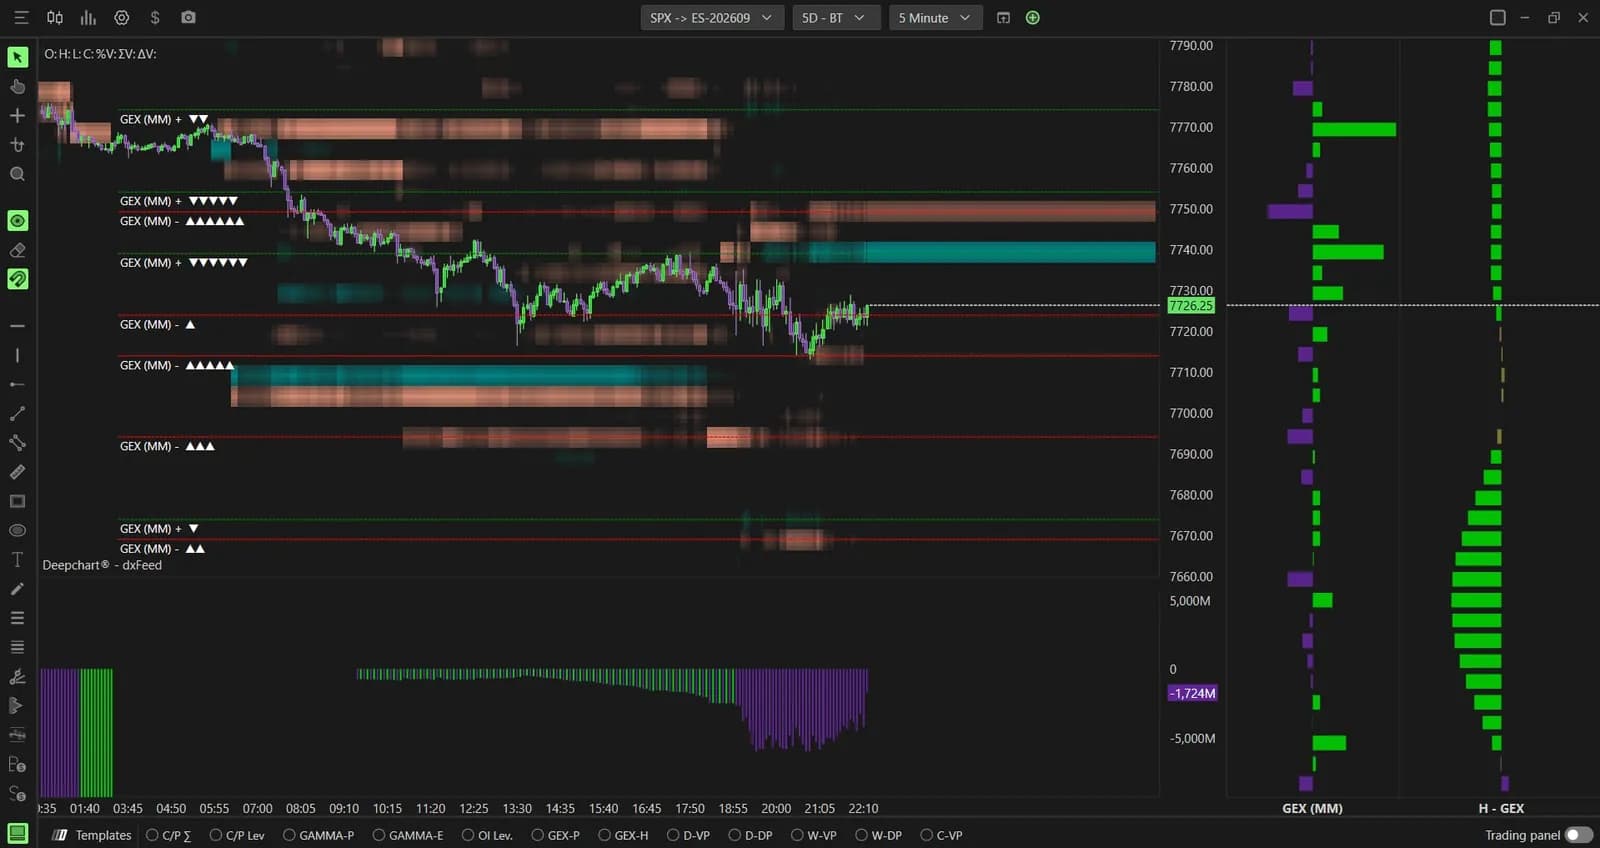
On a prop firm evaluation, that structure pays twice. The ranked levels give you fixed prices to plan around before the open, and they give your stop a reason to sit where it sits. Keep Number of levels low: every extra dashed line dilutes the ranking and adds one more price to second-guess when the tape speeds up.
Firms that run DeepCharts