Deep V Tracker: reading V reversals as they form
Acceleration, slowdown, exhaustion, then an absorption line at the same price: how the two modules of Deep V Tracker mark a turn, and the settings to start with.
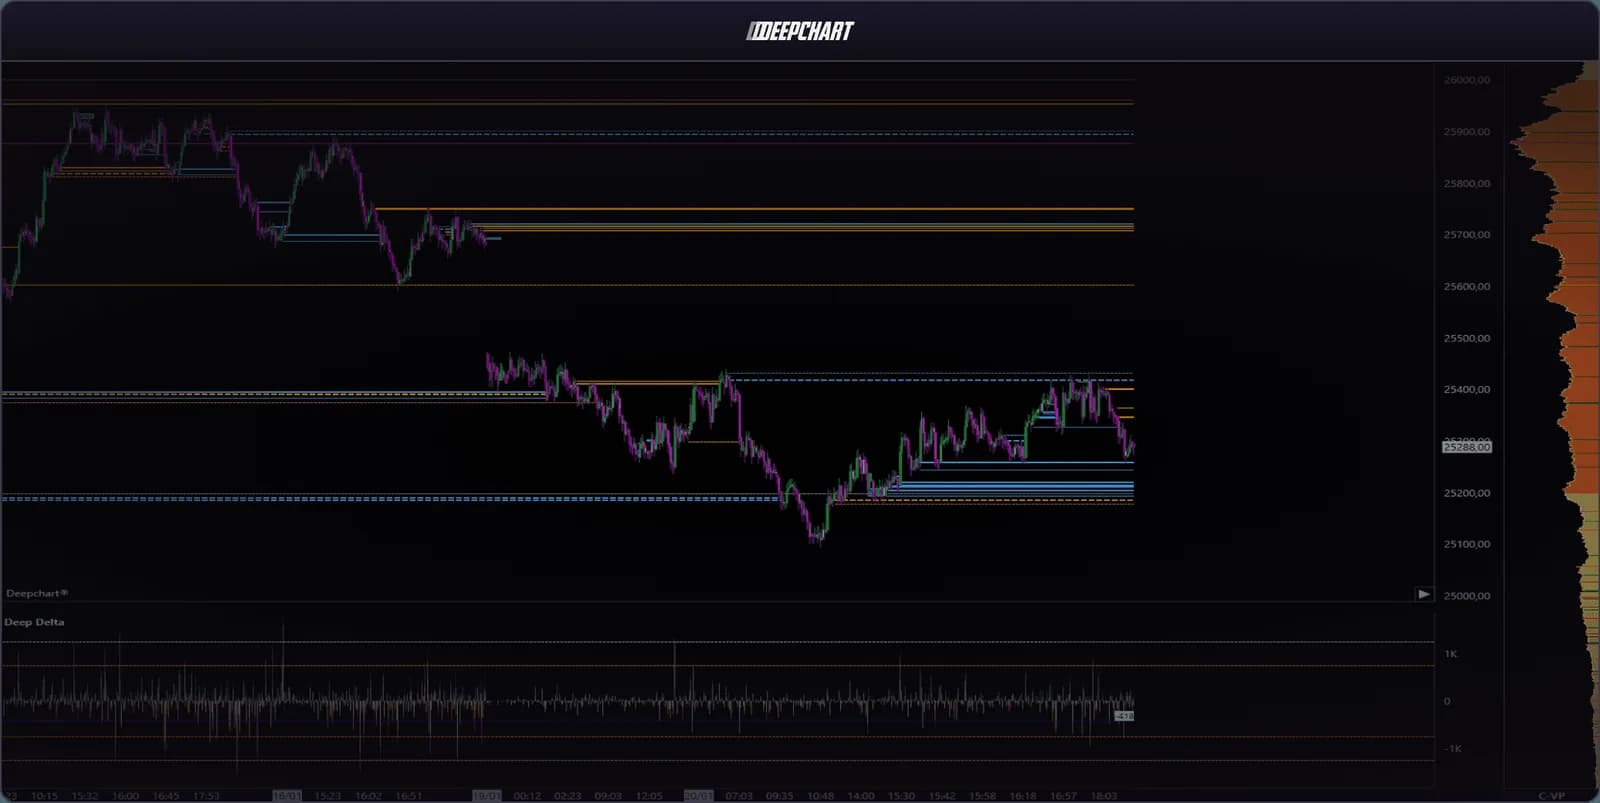
A V reversal is the hardest turn to trade from candles alone: the low prints in one bar, the bounce starts in the next, and by the time the chart looks like a V the entry is gone. Deep V Tracker is built for that moment. It watches the rhythm of aggressive orders and what they run into, and it marks both on the chart as the turn forms, not after.
The indicator in DeepChartsOFF has two modules that answer two separate questions. Patterns asks how the flow is behaving: speeding up, slowing down or running dry. Absorption Pressure asks where buyers and sellers actually hold control, and draws it as labeled lines at precise prices. Read together, they describe a move that is ending and a level where the other side is taking over.
What Deep V Tracker shows
Deep V Tracker shows the anomalies in the relation between price and volume, plus the price levels where pressure or absorption sits. Aggression on its own says little. What matters is its pace and what it meets on the other side of the book, and the two modules split those two readings instead of blending them into one signal.
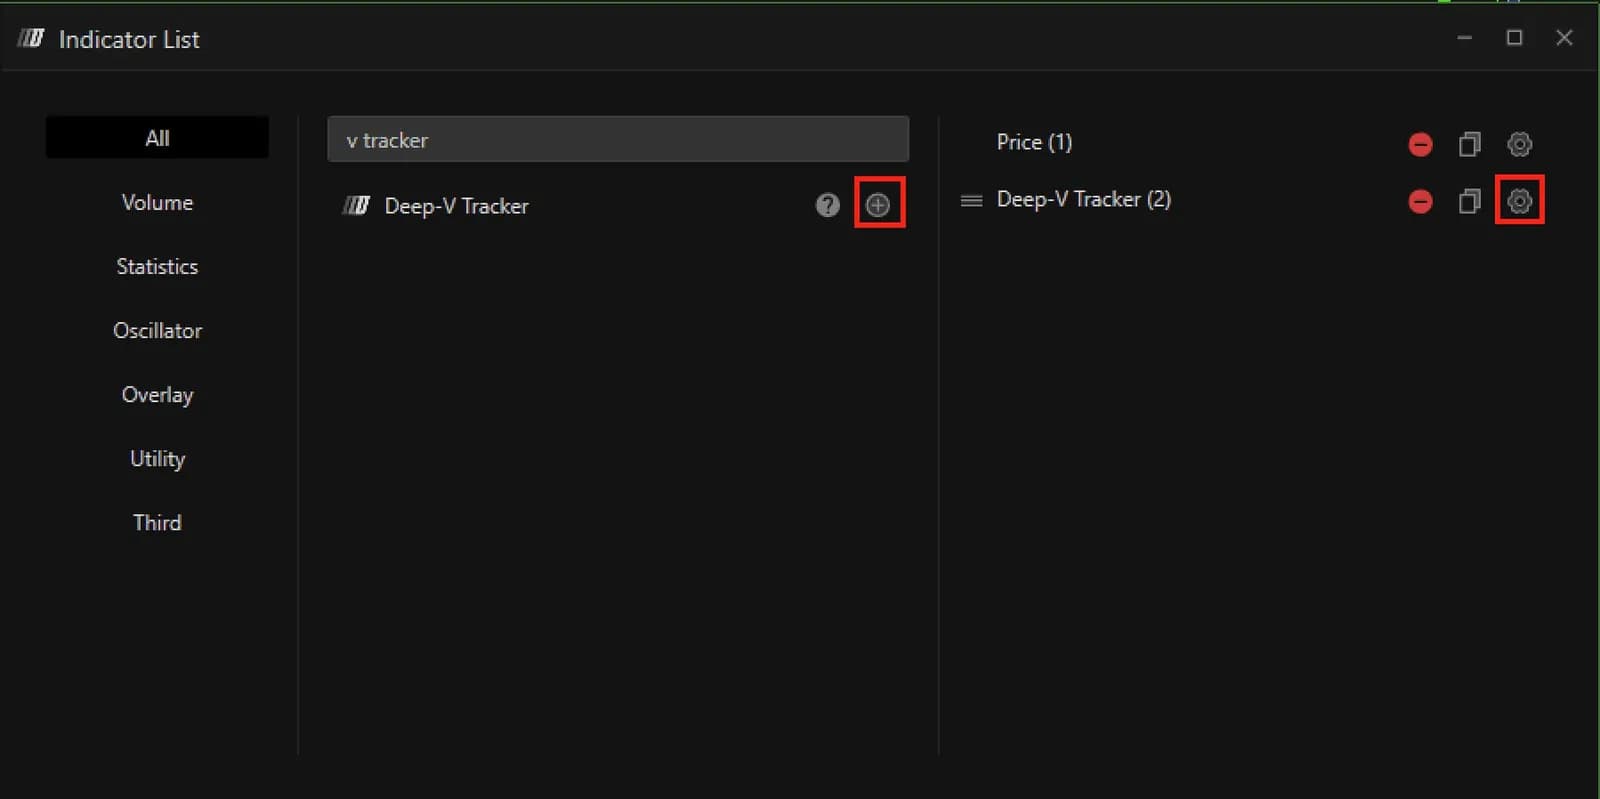
You add it from the indicator list, then open its settings with the gear icon. The panel has three tabs on the left: Patterns, Absorption-Pressure and Absorption-Pressure Alert. Each module is configured in its own tab, so you can learn one before switching on the other.
The Patterns module: acceleration, slowdown, exhaustion
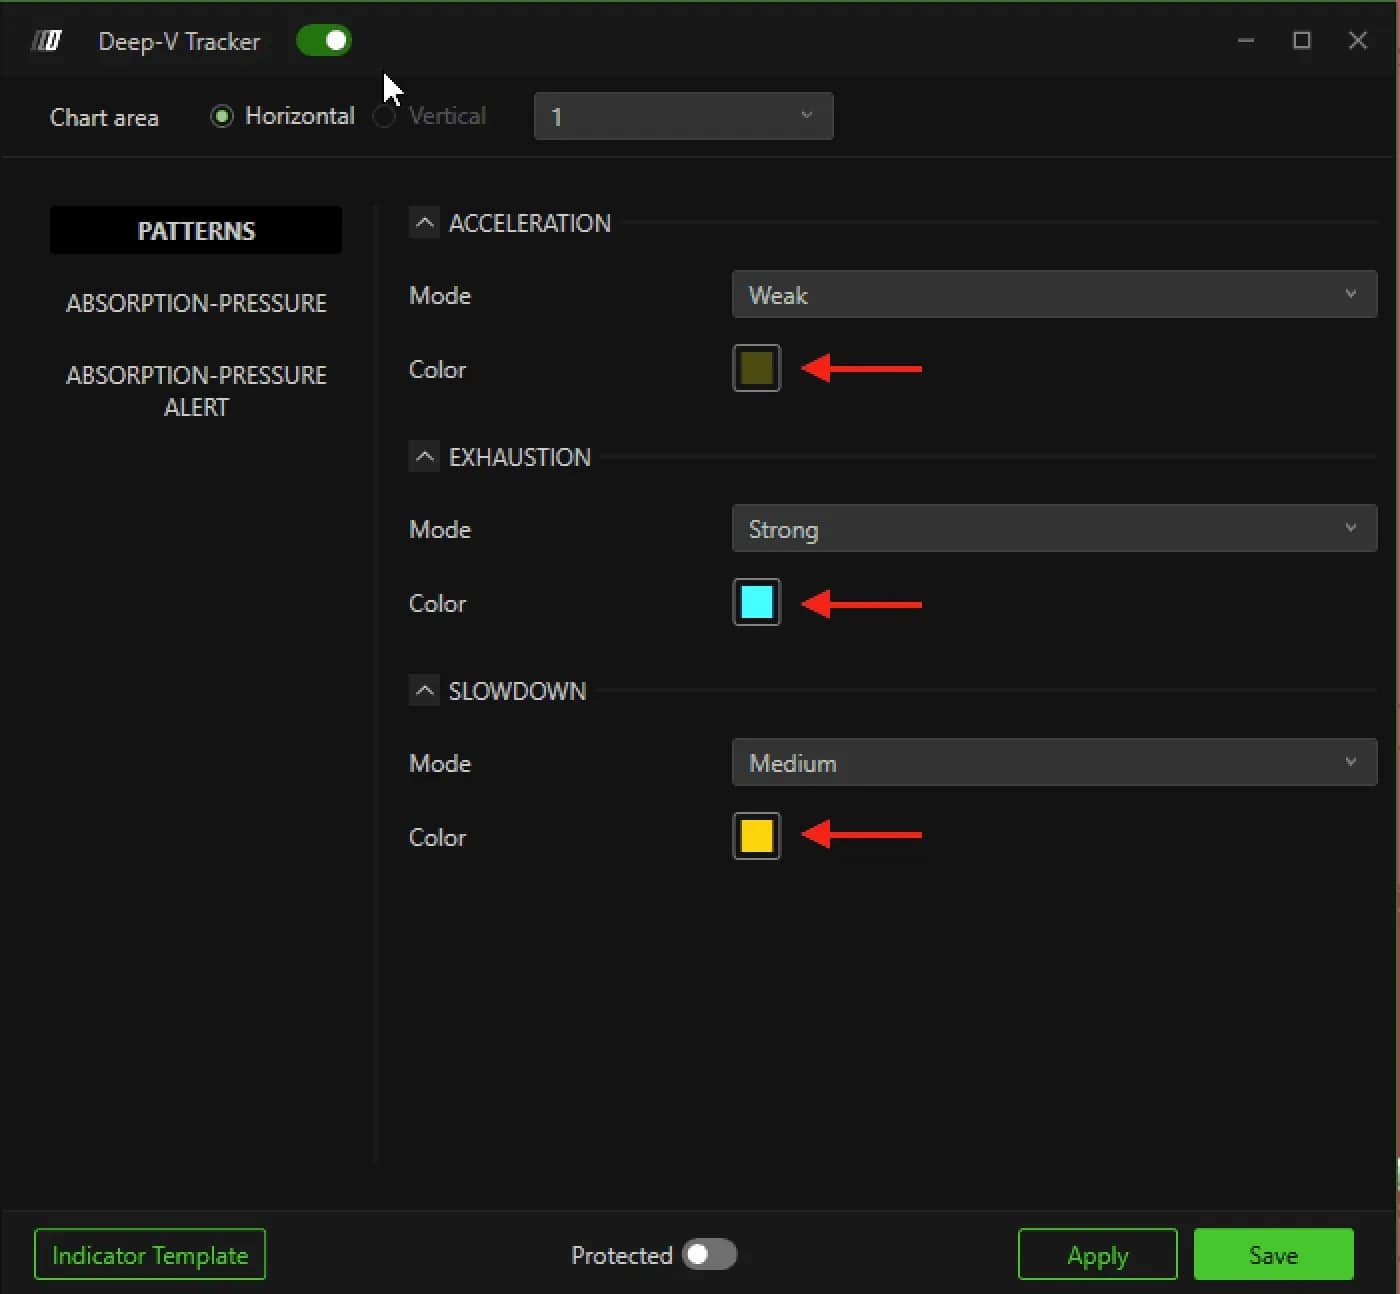
The Patterns module flags three behaviors of the flow, each with its own sensitivity and color. Acceleration marks a clear resumption of the directional move, an inflow of interest that pushes price on. Slowdown marks a loss of strength in the current move without yet calling a turn. Exhaustion marks the point where the buying or selling energy has drained, which often comes before a reversal.
Each category has a Mode, Weak, Medium or Strong, and a Color. Mode filters that category's noise: Strong keeps only the sharpest patterns, Weak shows more of them, including marginal ones. There is no on and off switch per category. To quiet one, set it to Weak or give it a color close to the background.
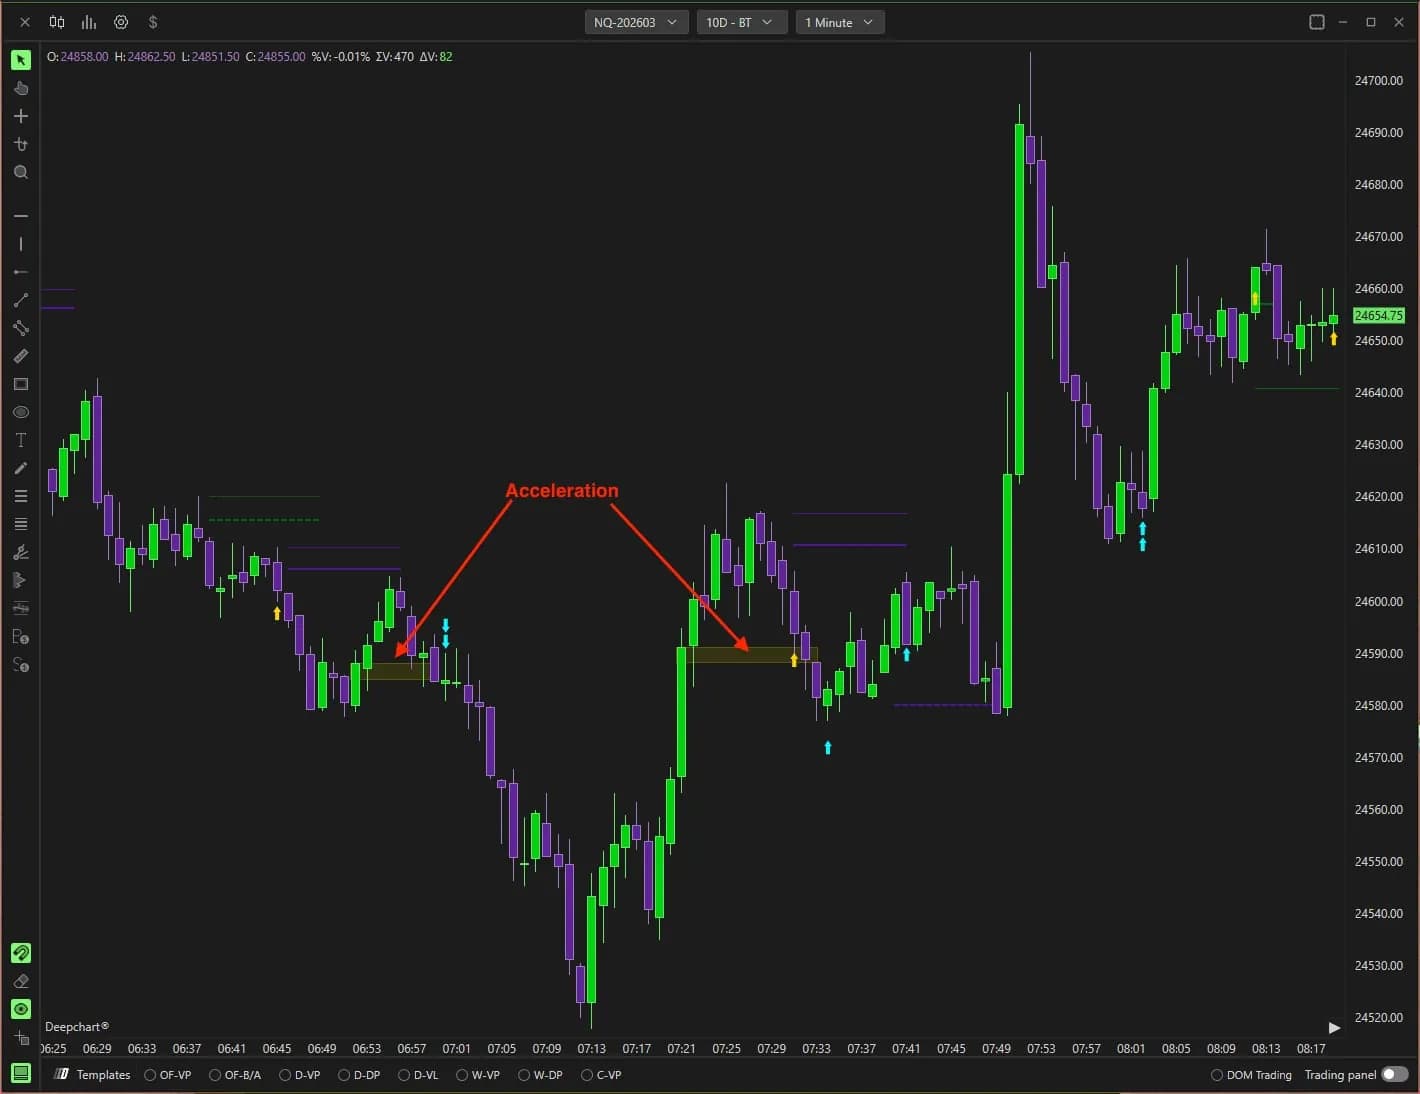
On an NQ one minute chart, acceleration shows as a shaded zone across the candle bodies where the push resumed. In the example below, two such zones are marked, and small colored arrows flag the other patterns as the session unfolds.
The Absorption Pressure module: P, A, C and E
The Absorption Pressure module draws horizontal lines where one side is either pushing hard or getting blocked. Two letters tell you which. P stands for pressure, sustained aggressive activity on one side. A stands for absorption: aggressive orders running into passive orders at the same price and failing to move it. If absorption itself is a new term, absorption vs exhaustion and the glossary entry on absorption lay out the difference first.
Two suffixes then tell you how to use the line. C, for Control, marks the level where a reaction is most likely. E, for Extreme, marks the zone beyond which the read is no longer valid. Colors follow the platform's convention: purple for selling pressure at the bid, green for buying pressure at the ask.
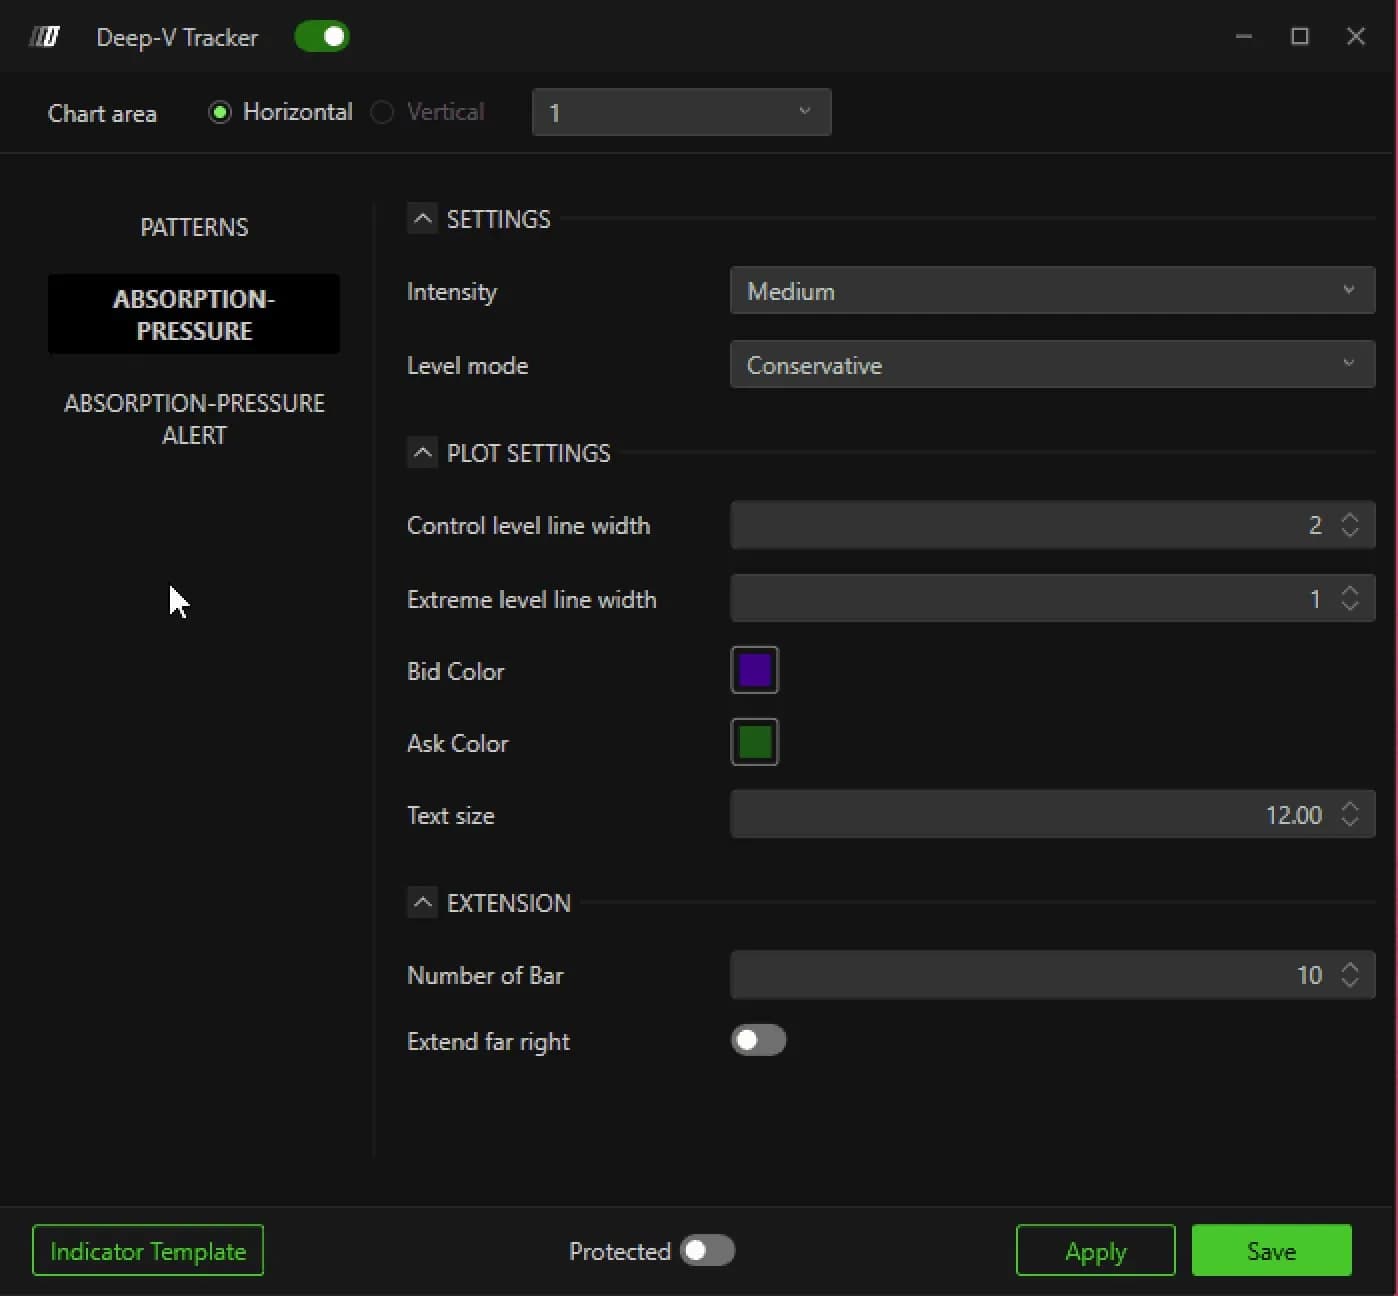
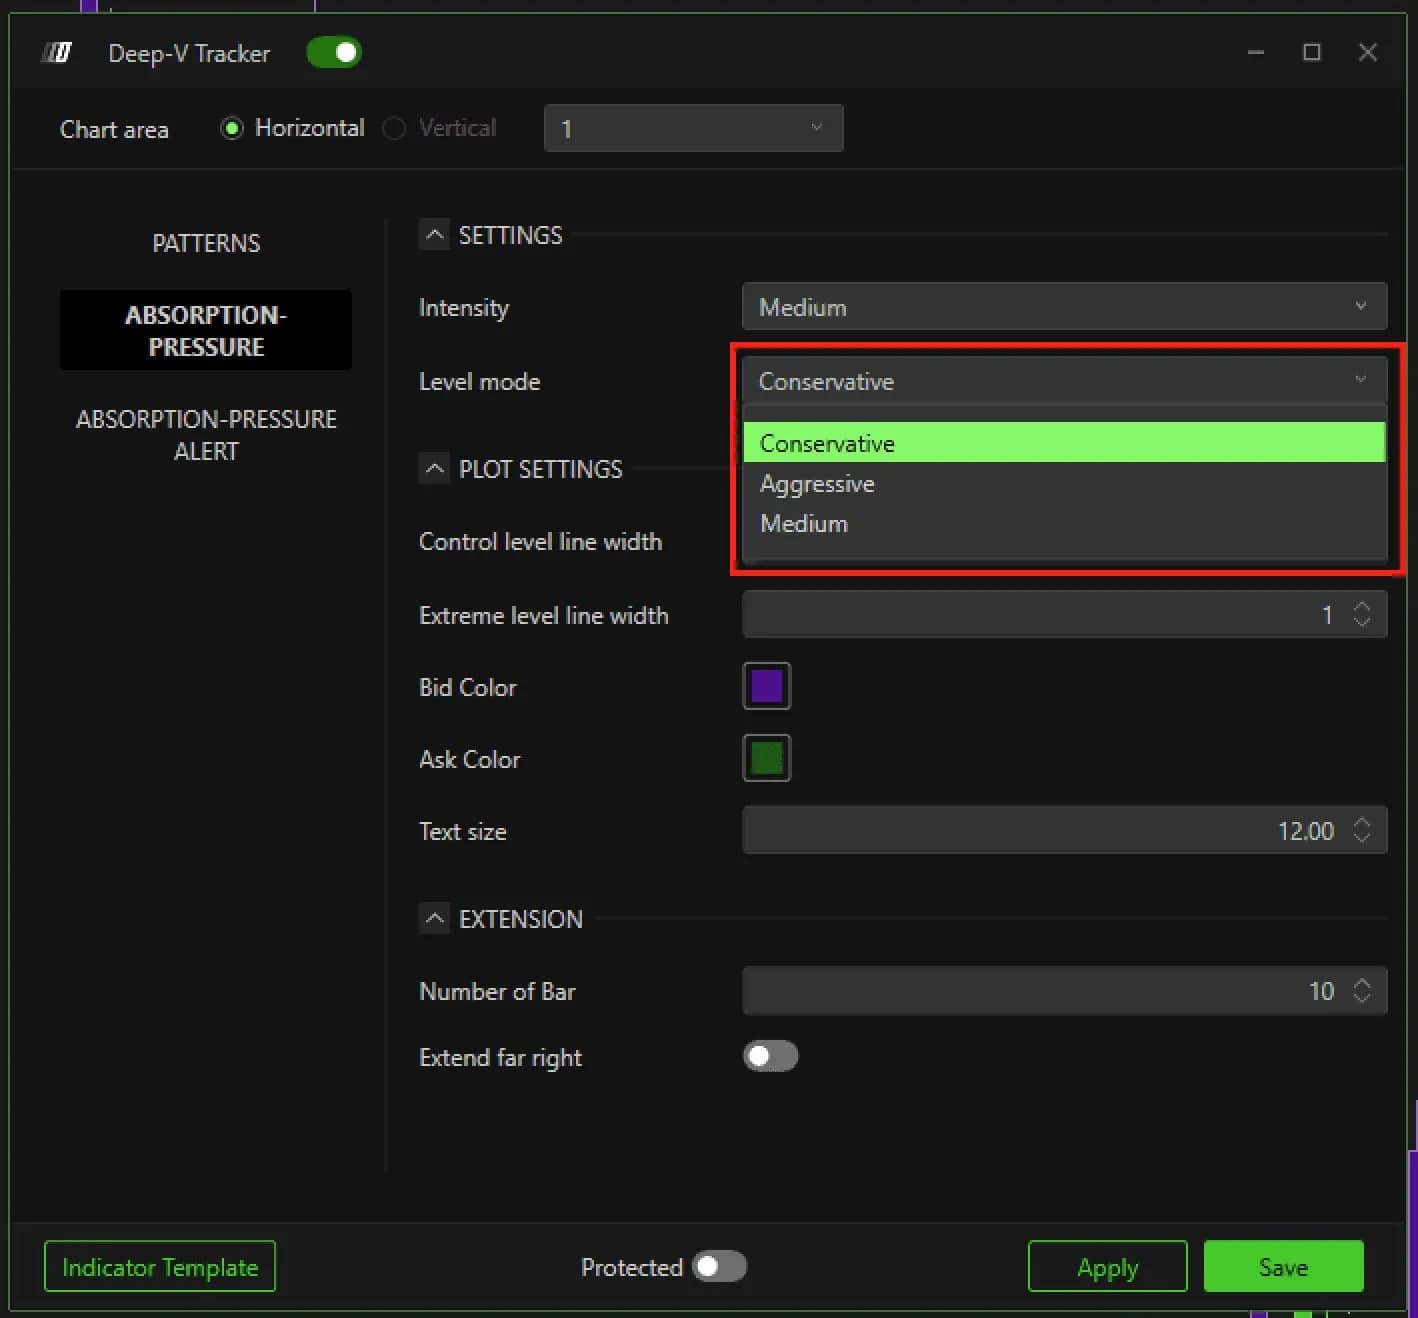
The module has its own filters. Intensity works like Mode in Patterns. Level mode, Conservative, Medium or Aggressive, sets how close price has to come to the market's structural thresholds before a line appears: Conservative reacts only to the most established levels, Aggressive reacts sooner and draws more lines.
Settings that matter
Three filters decide how many marks you get: Mode, Intensity and Level mode. The rest decides how readable they are.
| Setting | Default | What it changes |
|---|---|---|
| Mode (Patterns, per category) | Your choice: Weak, Medium or Strong | How many patterns of that category are drawn |
| Intensity (Absorption-Pressure) | Medium on the panel shown | Same filter, for pressure and absorption lines |
| Level mode | Conservative on the panel shown | How early a line appears near structural levels |
| Control level line width | 2 | Thickness of the C lines |
| Extreme level line width | 1 | Thickness of the E lines |
| Bid Color / Ask Color | Purple / green | Selling pressure at the bid, buying pressure at the ask |
| Number of Bar | 10 | Length of each horizontal line |
| Extend far right | Off | Carries the lines to the right edge of the chart |
Reading a V reversal in a live session
A V reversal shows on Deep V Tracker as a sequence, not a single mark: the flow accelerates into a level, slows, exhausts, and an absorption line appears at the same price. Take a hypothetical NQ session, in the first half hour after the 9:30 open. Price drops hard toward the overnight low and an acceleration zone shades the bodies of the selling candles. Two bars later a slowdown arrow prints, then an exhaustion mark. At the same price a green line labeled A with a C suffix appears: aggressive selling is hitting passive buyers and getting nowhere.
That combination describes a seller who has finished and a buyer who has taken over. The C line is where you look for a long, and the E line tells you where the idea is wrong. If price trades through E, the absorption gave way, and the same line has turned from support into a trap.
Two cross-checks make the read stronger. On a liquidity heatmap, the absorption level should match size actually resting in the book. And if large prints show up right at the low, the tools in our guide to Deep Trades and Big Trades tell you whether a big participant did the absorbing.
Alerts, and using it on an evaluation
The Absorption-Pressure Alert tab lets the indicator call you instead of you watching it. Enable Alert Sound turns the sound on, Alert Name gives the alert a name you will recognize in the list, and Enable Message adds a text that appears when it fires.
On a prop firm evaluation, the E line is the most useful part of the indicator because it gives every trade a defined place to be wrong. Measure the distance from your entry at the C line to just beyond E, convert it to ticks, and size from that number and your daily loss limit rather than from a fixed contract count. A wide gap between C and E on NQ is a reason to trade MNQ that day, not to skip the stop. Treat every mark as a place to look, and let the order flow at that price decide.
Prop firms that run DeepCharts