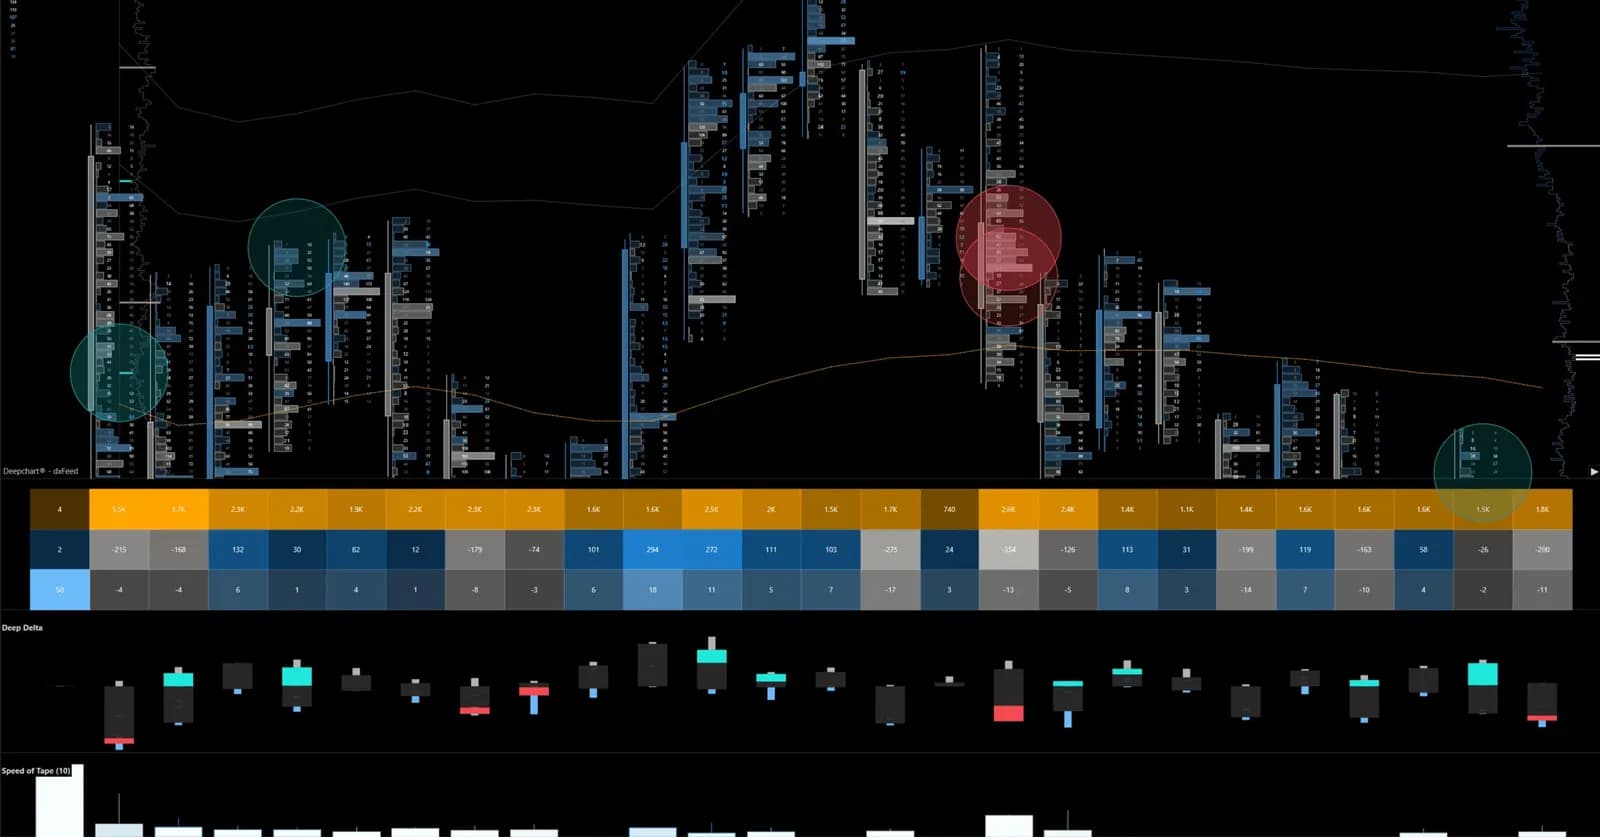
Spot large traders with Deep Trades and Big Trades
One reads MBO, the other any feed, and a big print is never a direction on its own: how to read large-trade clusters at a level, and the thresholds to set per instrument.
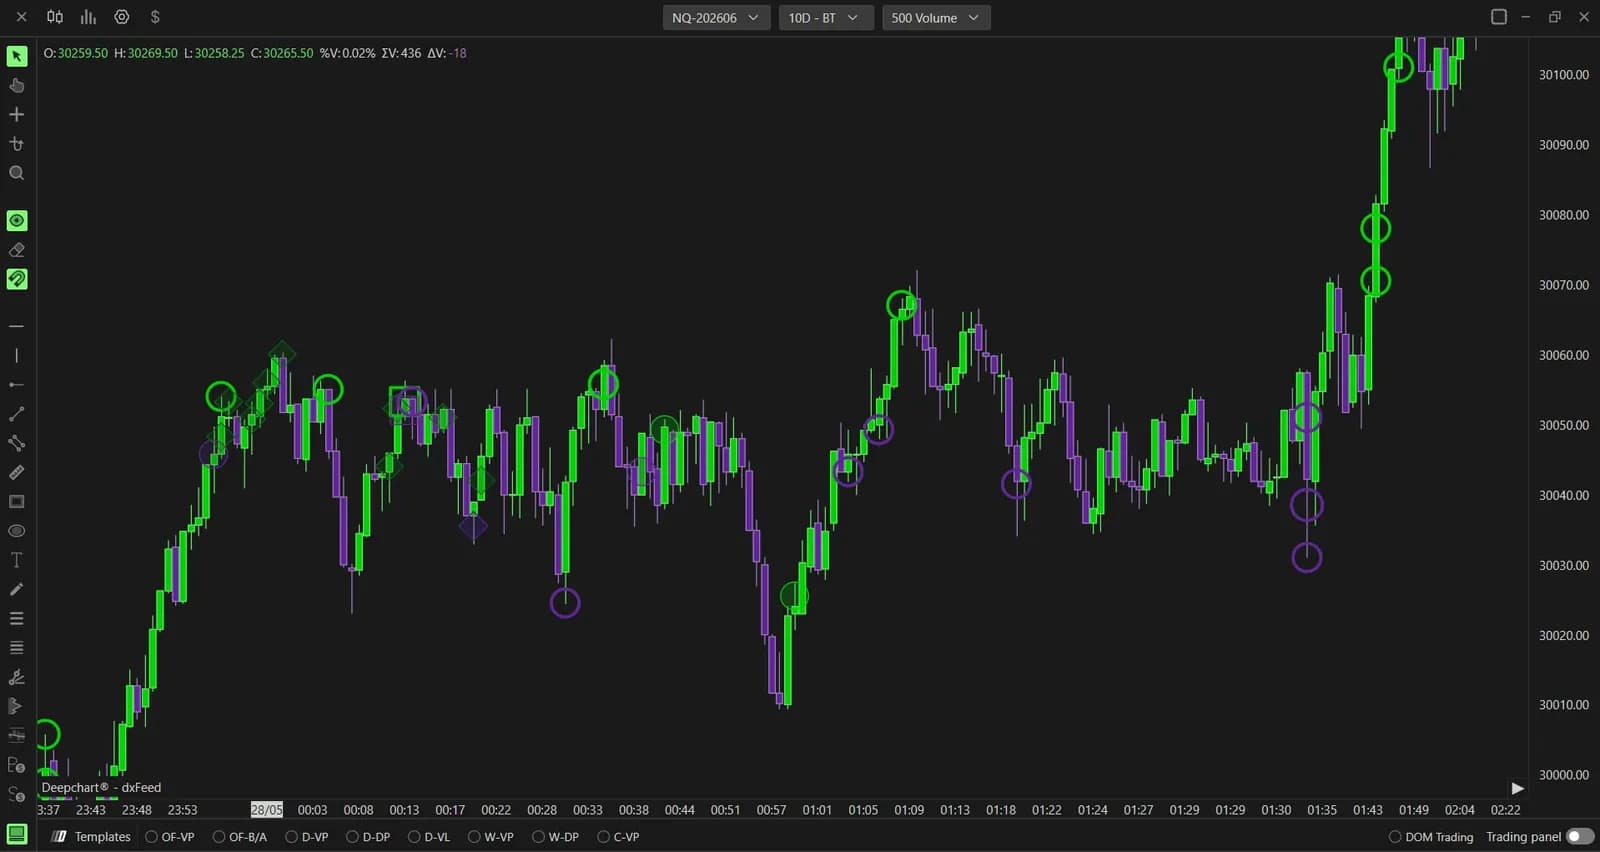
Not every print on the tape carries the same weight. A 200-lot hitting the bid on ES says something a stream of one-lots never will, and finding those prints quickly is a large part of reading order flow. DeepChartsOFF has two indicators for the job. Big Trades marks large aggressive orders on the chart as bubbles sized by volume, and can extend them into horizontal zones. Deep Trades goes a level deeper: it reads the order-by-order (MBO) feed to isolate large activity and classify it with four marker types.
The two share a history, which is why their names cause confusion. This guide sorts them out, explains how to read a large print in a live session, and walks through the settings that matter for each.
Big Trades and Deep Trades: which is which
Big Trades is the original large-trade indicator, and Deep Trades is a newer one built on MBO data. In version 15.6 the indicator formerly called Deep Trades was renamed Big Trades, with its function unchanged, and the Deep Trades name went to a new indicator. The practical difference is the feed:
- Big Trades works from the trades of a regular feed, grouped by default as Aggregate trades so that the fills of one aggressive order count as a single print rather than many small ones. Any standard connection runs it.
- Deep Trades needs a Level 2 feed with MBO enabled. Following each order individually is what lets it classify large activity into open circles, filled circles, squares and diamonds. Without MBO it stays empty, whatever the settings.
When in doubt, read the title of the settings window: it names the indicator you actually have open.
What a large print tells you, and what it does not
A large print tells you who is hitting hard and at which price; it does not tell you the direction on its own. A big execution can be an initiation, where price follows the aggressor, or an absorption, where passive size takes everything and price stalls. The two look identical on the marker. What separates them is how price behaves around the print in the next bars.
That is why these indicators work best as a layer, not a signal. Paired with the liquidity heatmap, they show whether the wall receiving the size held. Paired with the footprint and delta, they show whether aggression made progress. The distinction between a level that absorbs and a move that simply runs out of fuel is covered in absorption vs exhaustion.
How to read them in a live session
The useful read is a cluster at a level, judged by price's reaction. A single bubble is a data point; several large prints at the same price within a few minutes are a story.
Picture ES pushing to a session low during the US open. A knot of large Deep Trades markers appears at that low, right against a bright bid on the heatmap. Price fails to print lower and lifts away over the next bars. Large buyers came in to absorb the decline, and the cluster showed it as it happened. Had price kept falling through the cluster, the same markers would have described sellers initiating, not buyers defending.
Levels make the read sharper. A cluster that forms at yesterday's value area edge or POC, plotted with Deep Profile Values, carries more weight than one in the middle of nowhere. On NQ and ES, where large activity is frequent, this is where the indicators earn their place. On an evaluation account, that discipline matters: a marker is context for a trade you already planned at a level, not a reason to chase.
Setting up Deep Trades
Deep Trades is configured in four tabs, and the first one decides what appears while the other three only change how it looks. Add it from the indicator list, then open its settings from the list of active indicators.
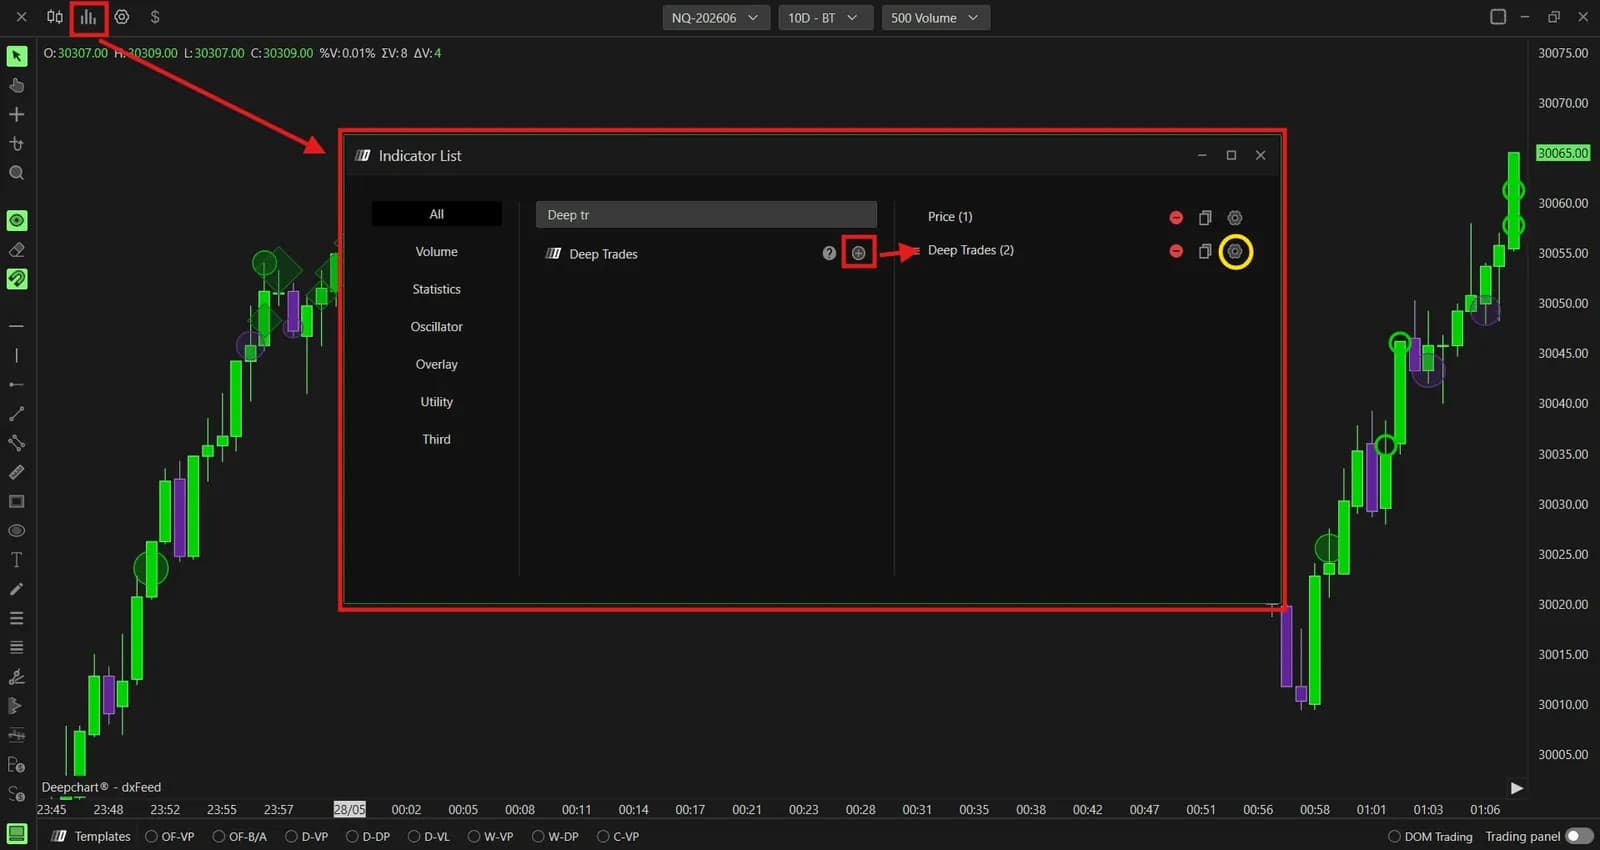
In Data Settings, Days to Load shows 10 days by default, but only days already collected on your machine: MBO history does not download retroactively, it builds up once the feed is active. On a fresh install, give it a few sessions. Filter Mode sets the size threshold: Manual uses Manual Filter, 60 by default, while Automatic adapts the threshold to the instrument's recent liquidity with an Intensity of Low, Medium or Strong.
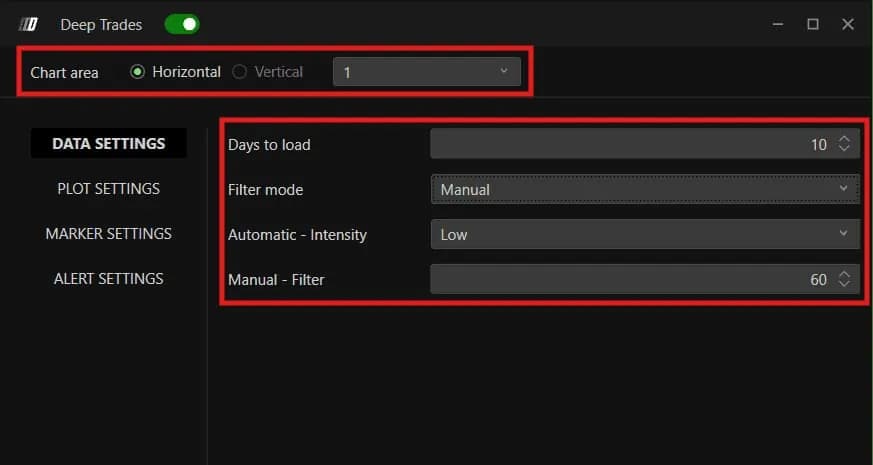
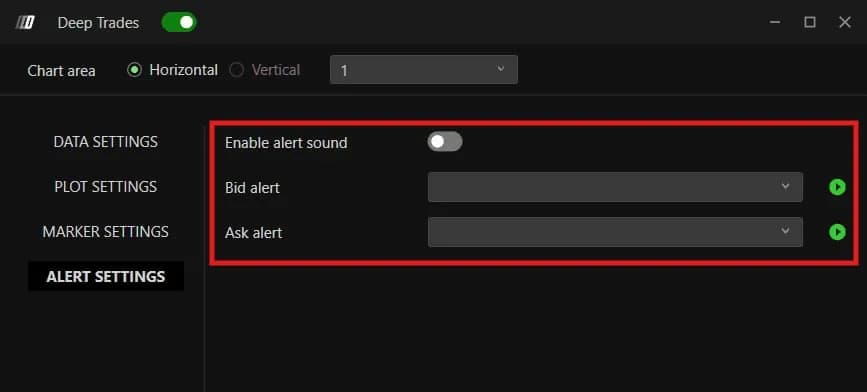
Plot Settings holds Standard Dev. at 2.50 and opacity bounds of 10 and 40, so prints that barely clear the threshold stay faint and the largest stand out. Each side has two colors, the battle variant marking the most contested trades. Marker Settings bounds symbol size between 8 and 12: widen it gradually if every marker looks the same. Alert Settings, off by default, plays separate sounds for bid and ask pressure, useful when you are watching another screen.
Setting up Big Trades
Big Trades needs one decision above all: the size threshold, and it belongs to each instrument. In Data Settings, Manual Filter Min. is the smallest trade plotted, 30 contracts in the reference screenshot, with Manual Filter Max. left at 0. A threshold tuned for ES floods an NQ chart or shows nothing on MNQ, so keep one template per symbol and raise the filter until only a handful of bubbles remain per session.
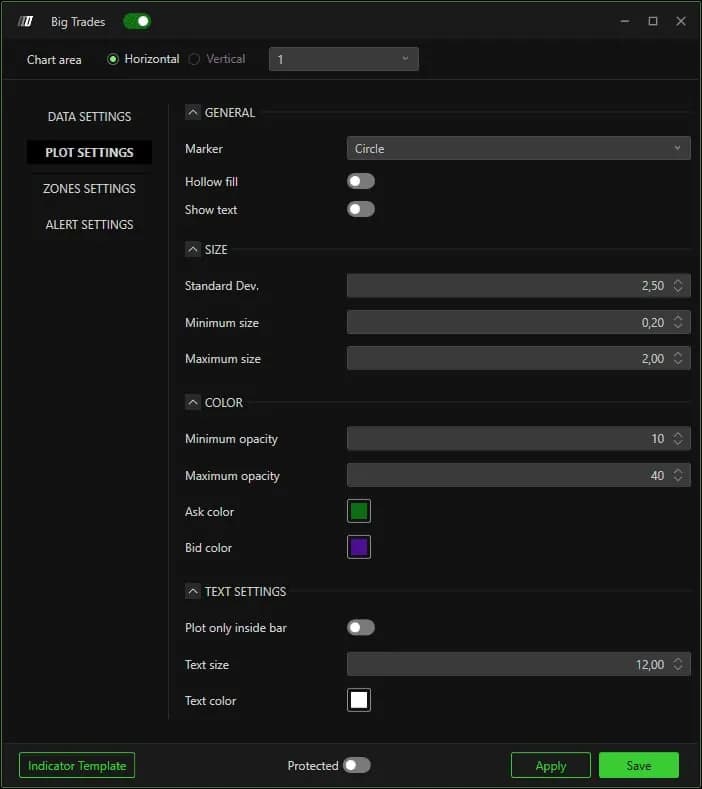
Plot Settings shapes the bubbles. Hollow fill draws outlines only, which keeps a busy footprint readable, and Show text prints the trade size inside. Leave Standard Dev. at its default, as the platform recommends, and let the opacity range make the largest trades stand out.
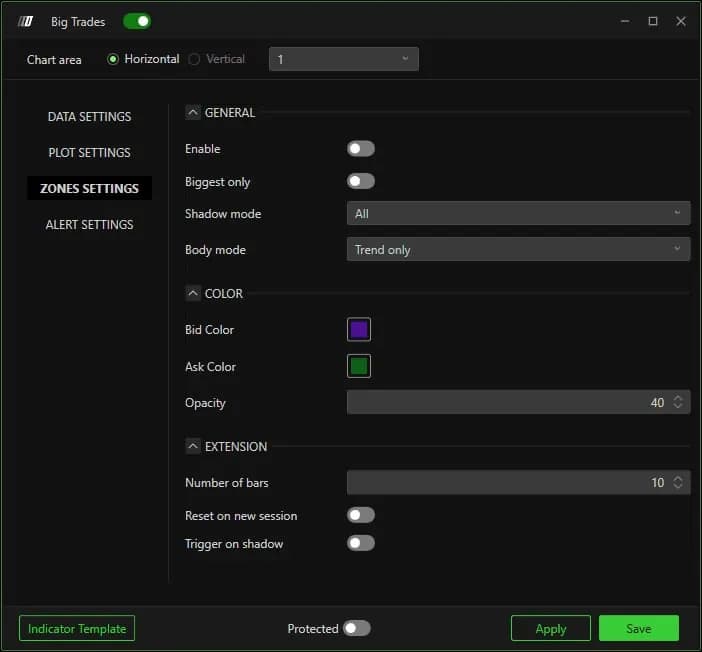
Zones Settings turns qualifying trades into horizontal zones extended to the right, 10 bars long in the reference screenshot. Shadow mode handles prints in the wick, Body mode those in the candle body: Reverse only keeps the side fighting the candle, Trend only the side moving with it.
| Setting | Default | What it changes |
|---|---|---|
| Days to Load (Deep Trades) | 10 | Days of locally collected MBO history shown |
| Filter Mode, Manual Filter (Deep Trades) | Manual, 60 | Size threshold for a marker |
| Marker Size (Deep Trades) | 8 to 12 | Range between the smallest and largest symbols |
| Input data (Big Trades) | Aggregate trades | Groups the fills of one aggressive order into a single print |
| Manual Filter Min. (Big Trades) | 30 in the reference screenshot | Smallest trade plotted, to set per instrument |
| Number of bars (Big Trades zones) | 10 in the reference screenshot | Length of each zone to the right |
Let Big Trades Analysis set the thresholds
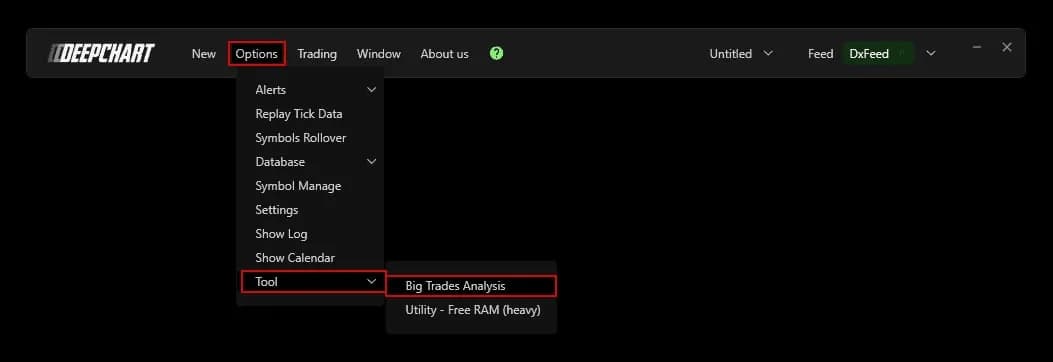
Big Trades Analysis computes a threshold for each symbol so you do not have to hunt for one. Set Filter mode to Automatic in Data Settings, choose an Intensity, and save. Then open Options, Tool, Big Trades Analysis in the menu bar and run it. The analysis studies each symbol's price behavior and volatility and saves the results, so running it once a week or once a month is enough. If the bubbles do not change straight away, reload the chart.
With the threshold set per instrument and the zones kept sparse, both indicators stay quiet most of the session and speak up when size actually arrives. Plans and market data costs are on our platform page.
Firms that run DeepCharts