Option Big Flows and Option Profile: option walls
Large SPX option tickets on the chart, opened or closed, and the call and put walls strike by strike: how to read both, set them up and confirm on ES.
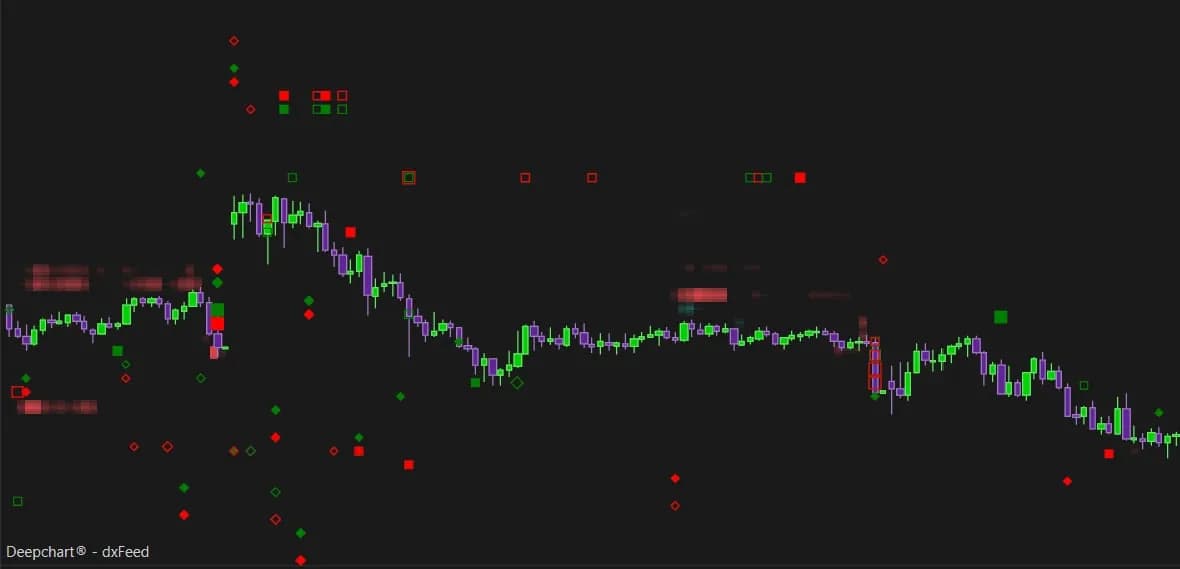
The futures tape tells you what is trading in ES and NQ right now. The options market often tells you where large money is positioning before the index moves, and two DeepGammaOFF indicators bring that information onto the chart you already watch. Option Big Flows plots the large option tickets as they print, with their side, their direction and whether a position is being opened or closed. Option Profile stacks options activity strike by strike, so the levels where calls and puts pile up sit right next to price.
One is the event, the other is the map. Together they give an order-flow trader a frame for the session that the futures book alone cannot draw.
What Option Big Flows shows on the chart
Option Big Flows marks every SPX option trade whose premium exceeds a threshold you set, one million dollars by default, and packs four facts into a single marker. The shape gives the side: a diamond for a call, a square for a put. The color gives the action: green for a buy, red for a sell. The fill gives the intent: a solid marker opens a position, a hollow one unwinds it.
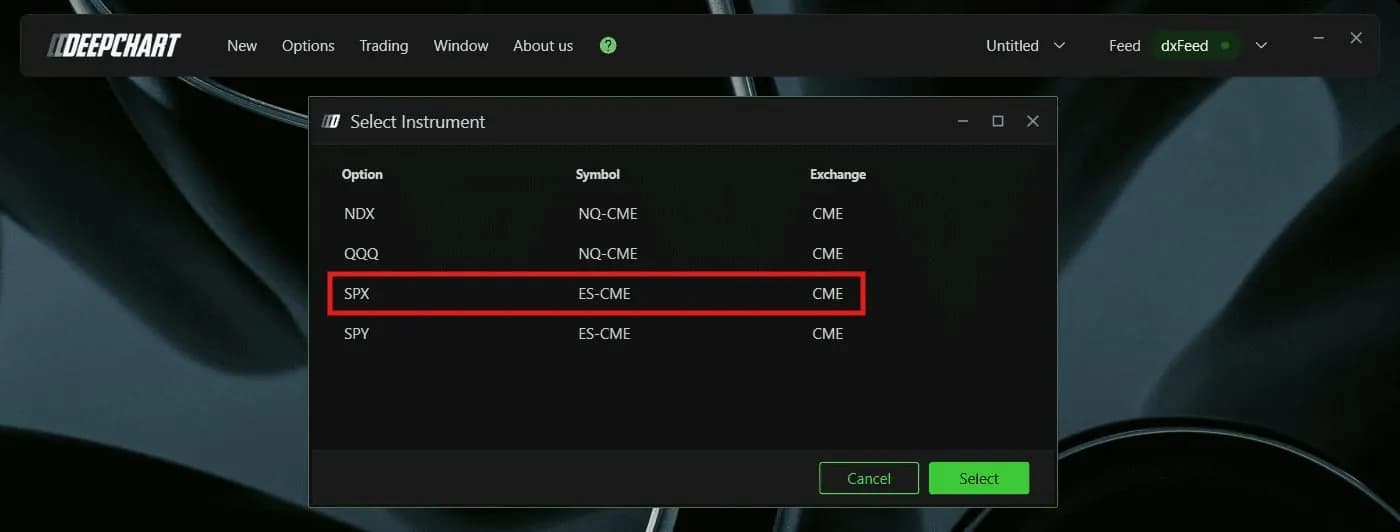
That last piece is the one most retail option feeds leave out: a call buy that opens a fresh long and one that covers an old short tell opposite stories. To settle it, the indicator relies on real Cboe participant data, which is why it runs on SPX only. You open it from New, then Option Chart, and pick SPX, which maps to the ES-CME symbol on the CME exchange.
How to read big flows in a live session
A marker is an alert to go and read your futures order flow, not a trade signal on its own. The useful question is always the same: does the tape on ES confirm what the options ticket suggests?
Take a hypothetical late morning on ES. The index holds its highs, and a cluster of solid green squares prints: opening put buys worth several million in premium. Price has not moved, but someone is paying up for protection. If buyers stop lifting the offer and the bid thins out over the next bars, the options flow showed the imbalance first. If ES keeps absorbing sellers, the puts were most likely insurance on a long portfolio you cannot see.
Two tips make this read cleaner. First, remember that color encodes the literal action, so a large put buy shows up green even though it leans bearish. If you prefer to read sentiment, invert the colors in the Put Plot tab only, and green then means up across both sides. Second, watch the US cash open and macro releases, when large players reposition. A big ticket that lands on a strike already loaded with gamma, as shown in our guide to the GEX Profile and GEX Heatmap, deserves more attention than one that prints in empty space.
Setting up Option Big Flows
Only one setting changes what you see, Min. Premium (USD); the other tabs change how it is drawn. Lower it too far and the chart fills with markers until the word big stops meaning anything.
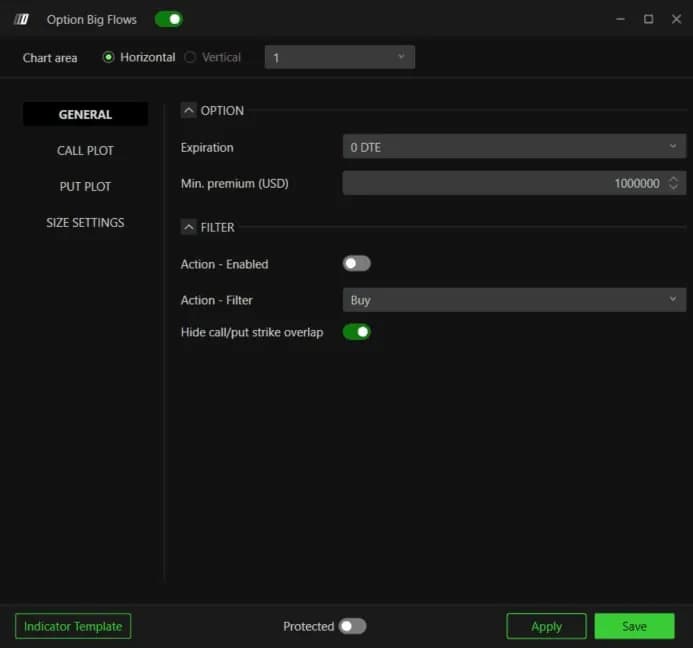
Expiration starts on 0 DTE, the same-day options whose flow weighs on the session immediately, and widens up to All expirations. Hide call/put strike overlap is on by default and is worth keeping on: it hides a call and a put executed at the same strike at the same moment, structures whose net directional exposure is close to zero.
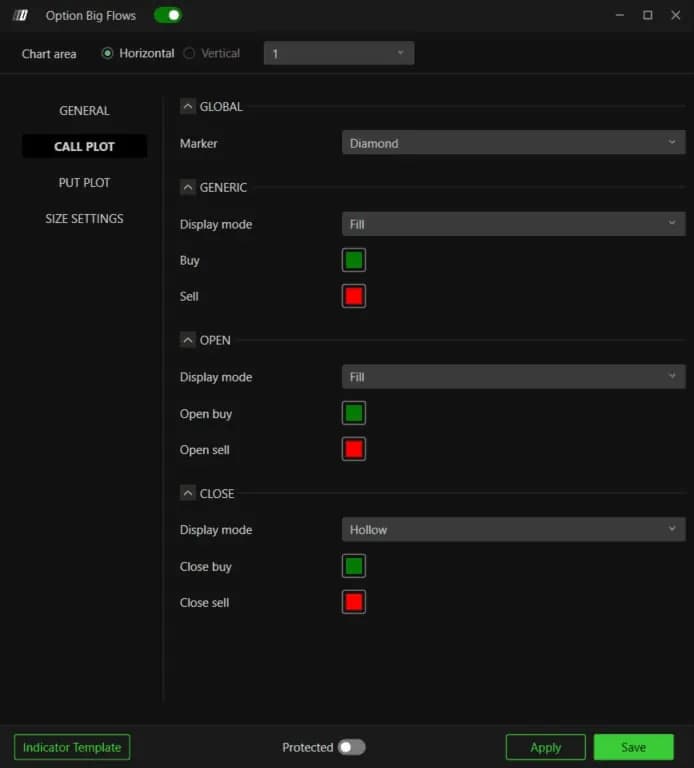
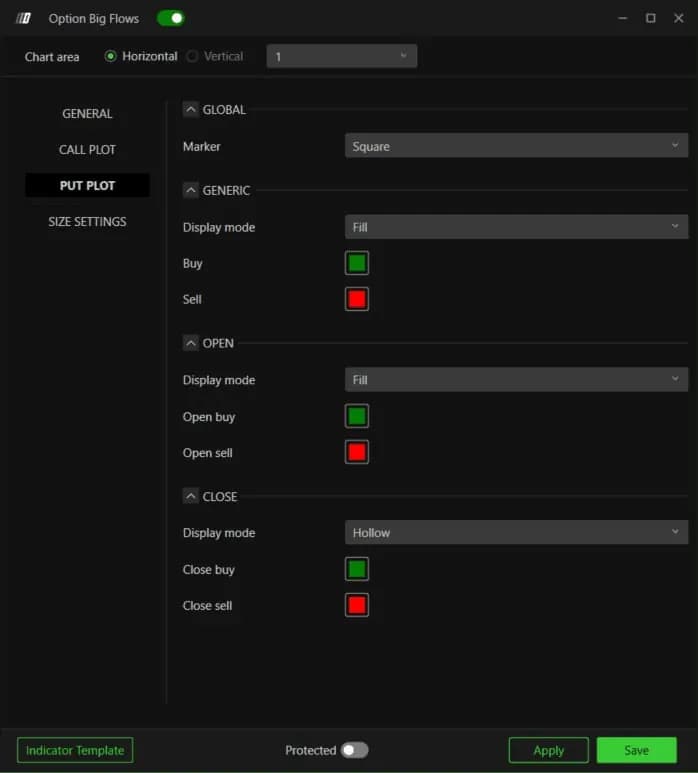
| Setting | Default | What it changes |
|---|---|---|
| Min. Premium (USD) | 1,000,000 | Trades below this premium are not plotted |
| Expiration | 0 DTE | Widens to 1 to 7 days, 31 d, 91 d or All expirations |
| Action - Enabled | Off | When on, Action - Filter keeps only buys or only sells |
| Hide call/put strike overlap | On | Hides offsetting call and put trades at the same strike |
| Marker (Call Plot / Put Plot) | Diamond / Square | Shape separates calls from puts |
| Open / Close Display mode | Fill / Hollow | Solid opens a position, hollow unwinds it |
| Marker min / max size | 60 / 120 | Size range of the markers on screen |
| Marker max std dev | 1.0 | Premium deviation at which a marker reaches full size |
What Option Profile shows
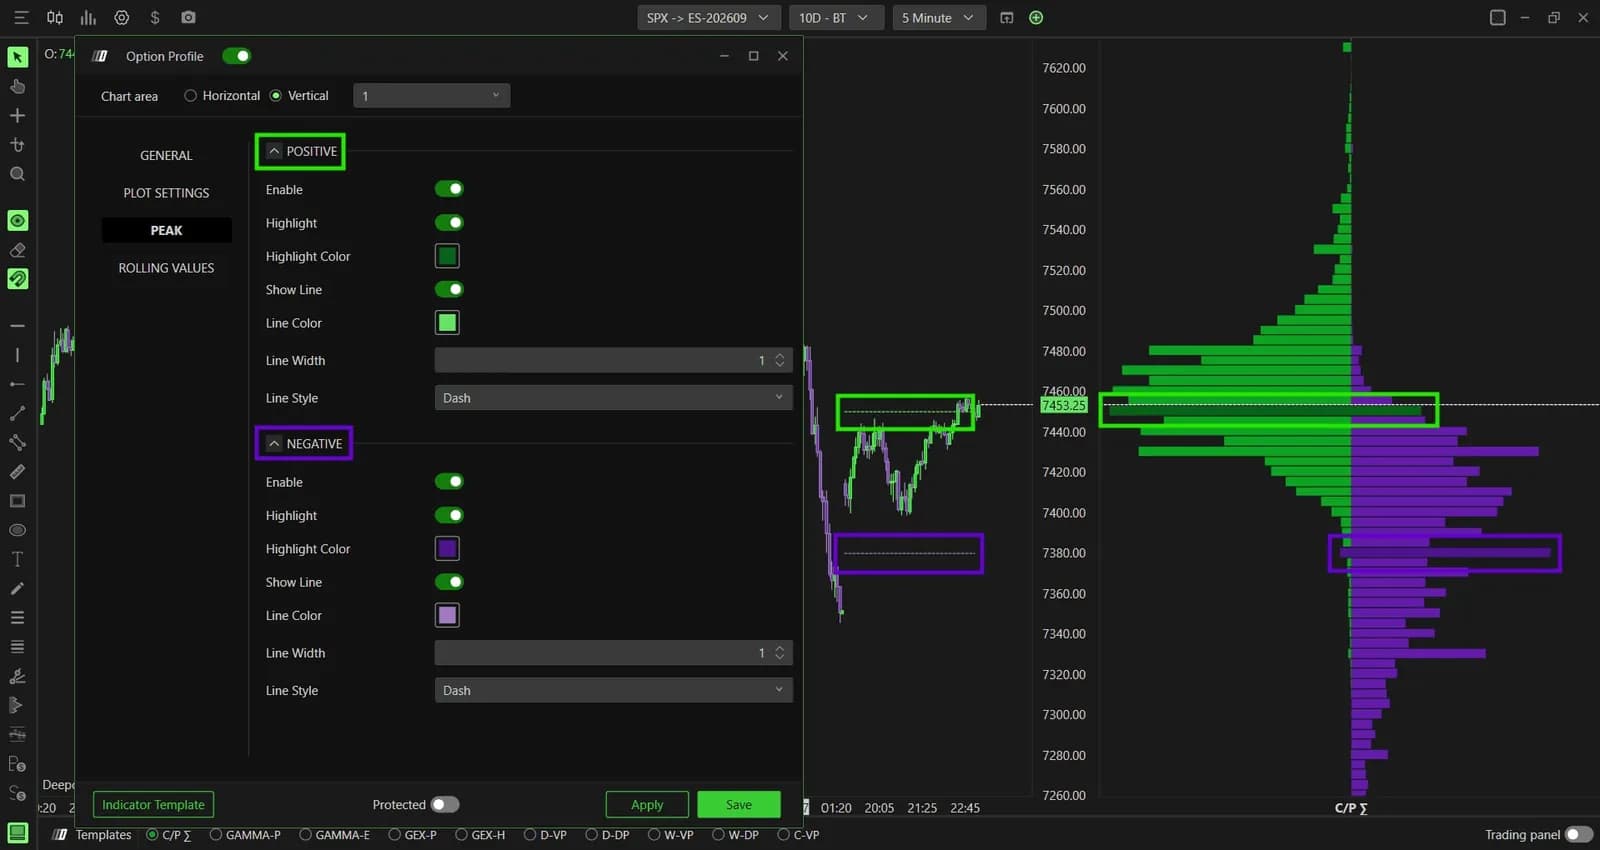
Option Profile is a volume profile built on options activity: for each strike, a green bar on the left measures call volume and a purple bar on the right measures put volume. Activity concentrates on a few strikes, and those become reference levels because market makers have to hedge around them.
The largest green bar is the call wall, a level that can act as resistance if price rises into it. The largest purple bar is the put wall, a potential support on the way down. When price sits between the two, the session tends to rotate inside that range more often than it breaks cleanly out of it. The indicator covers NDX, QQQ, SPY and SPX: an Option Chart on NQ-CME follows NDX or QQQ, one on ES-CME follows SPX or SPY.
Reading the walls during the session
The walls frame the session; your futures order flow tells you whether price reacts there. You use them to place targets, not as entries.
Say the call wall on ES sits well above the current price and the put wall below it. A long taken off the put wall has a natural target just under the call wall. When price finally reaches the call wall, you look for absorption on the footprint before you consider a fade, and a clean break with aggressive buying tells you the wall has been taken. The gamma context sharpens this: above the gamma flip a wall tends to slow price, below it a wall is more likely to be run through. The mechanics are explained in GEX for futures traders, and the Gamma Bands and Expected Move give a second, complementary frame for the day's range.
Setting up Option Profile
Three choices shape the read, Data source, Expiration and the Peak lines; everything else is layout. The quickest way in is the C/P Σ button in the templates bar at the bottom of the window, which loads Option Profile with its last settings, and a right click on it opens Settings directly.

Data source switches between Volume, the raw activity at each strike, and Gamma volume, the same volume weighted by each option's gamma. Expiration matters more than it looks: on All expirations the walls barely move from day to day, while short maturities show the positioning actually at work in today's session.
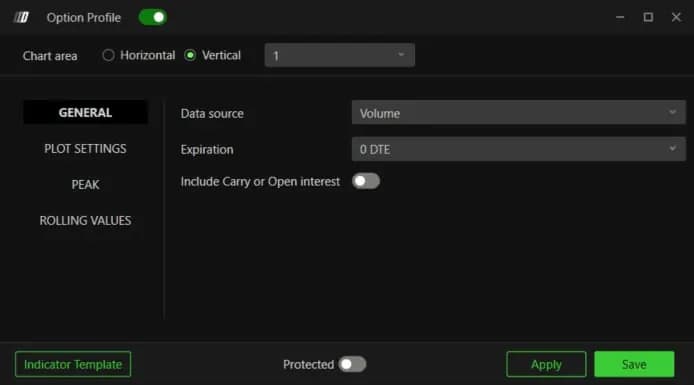
| Setting | Default | What it changes |
|---|---|---|
| Data source | Volume or Gamma volume | Raw activity, or activity weighted by gamma |
| Expiration | A single DTE, up to All expirations | Which maturities build the profile |
| Include Carry or Open Interest | Off | Adds prior open interest to the day's volume |
| Number of profile | 5 | Sessions displayed at once |
| Vbp opacity | 90 | Transparency of the bars |
| Peak Show Line / Highlight | On / On | Dashed line and colored bar at each side's dominant strike |
Using both on a prop firm evaluation
On an evaluation, options flow is context for your futures trades, never a reason to enter on its own. It helps you place targets and stay out of trades that run straight into a wall, while the entry still comes from the tape on ES, NQ or their micros.
Both indicators come with the DeepGammaOFF module, which is part of some DeepChartsOFF plans and not others. Check which plan includes it on our page about the platform before you build a layout around it.