Session Imbalance: the Initial Balance, drawn right
High, low, midpoint and 50% and 100% extensions of the first hour: the start time that makes the lines right, how far they run, and how to trade the retest.
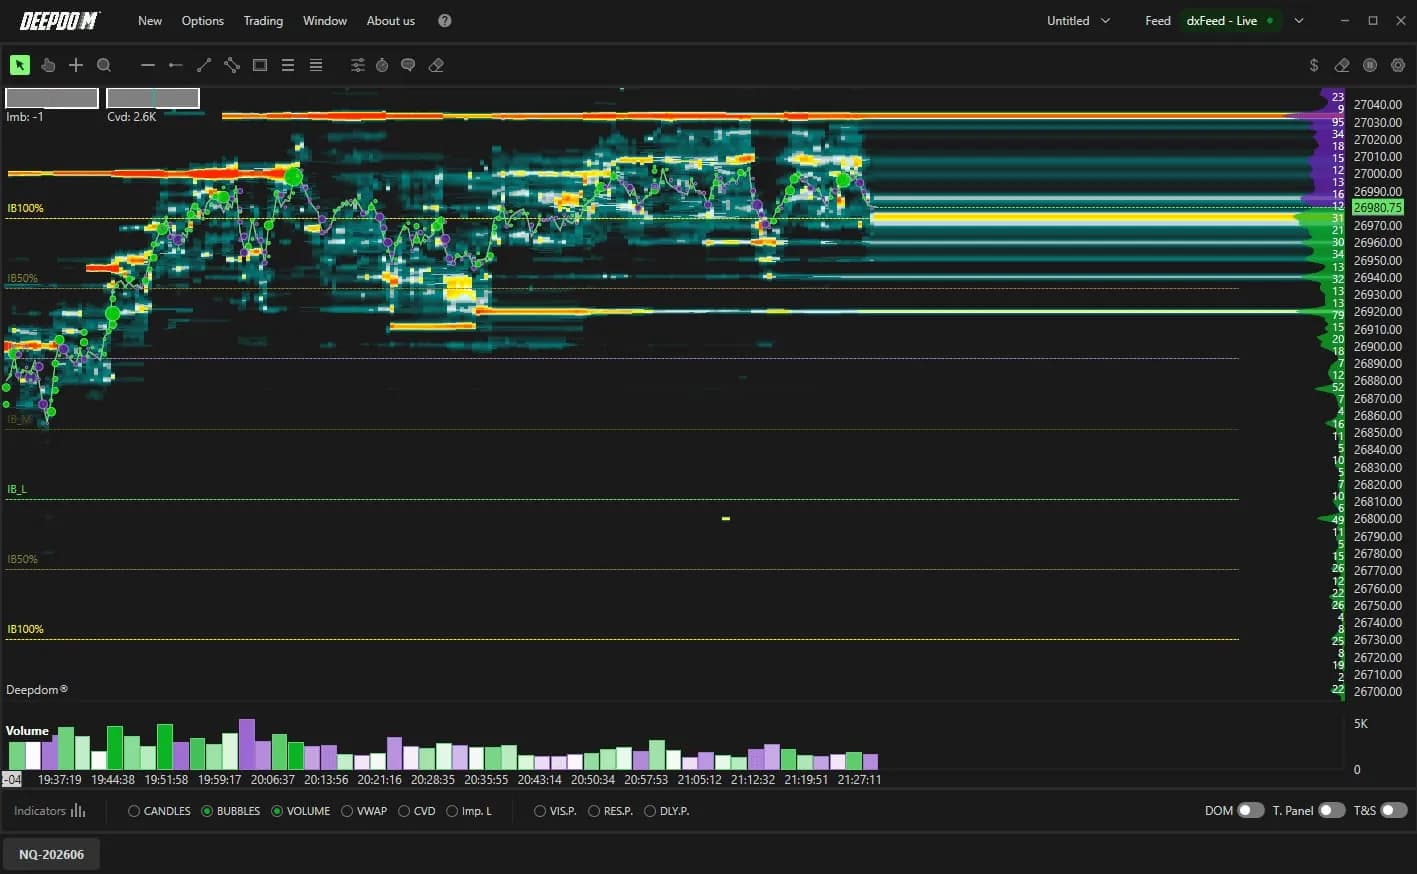
The first hour of the regular session sets the frame for the rest of the day. Its high and low, known as the Initial Balance, become the boundaries the market tests, breaks or rotates back into for hours afterwards. Session Imbalance, an indicator of DeepDomOFF, draws that frame for you: the high, the low, the midpoint and the measured extensions on both sides, without a single line drawn by hand.
The tool is simple, and that is its strength. One setting decides whether the lines are right, a few more decide how readable they are, and the rest of the work happens in the order flow at each boundary.
What Session Imbalance draws
Session Imbalance plots the Initial Balance of each session and projects measured targets beyond it. The chart labels make the five levels easy to name. IB_H is the high of the initial window and IB_L its low. IB_M is the exact midpoint between them. IB50% and IB100% are extensions projected at 50% and 100% of the initial range, above and below.
That gives up to seven lines. Three of them, IB_H, IB_L and IB_M, were actually traded during the window. The four extensions are calculations: useful as targets, but of a different nature. Keeping that difference in mind is most of what reading the tool well requires.
Why the first hour matters to an order-flow trader
The Initial Balance matters because a large share of the day's volume trades in it, so its edges are prices the market has already accepted or rejected. When price returns to IB_H or IB_L later in the day, the question is simple and the footprint can answer it: does the boundary hold, or does it give way?
A boundary that holds shows absorption on the retest: heavy volume traded into the level and price that does not progress. A boundary that breaks shows aggressive volume carrying price through and staying beyond it. The difference between the two, and how to tell absorption from a move that simply ran out of buyers, is covered in absorption vs exhaustion.
Setting the window: length and start time
The GENERAL section holds three fields, and the start time is the one that makes the indicator right or wrong. Number Minutes is 60 by default, the most widely followed convention. Keep it. These levels are useful because many traders watch the same ones, and a window that changes every day produces lines only you can see.
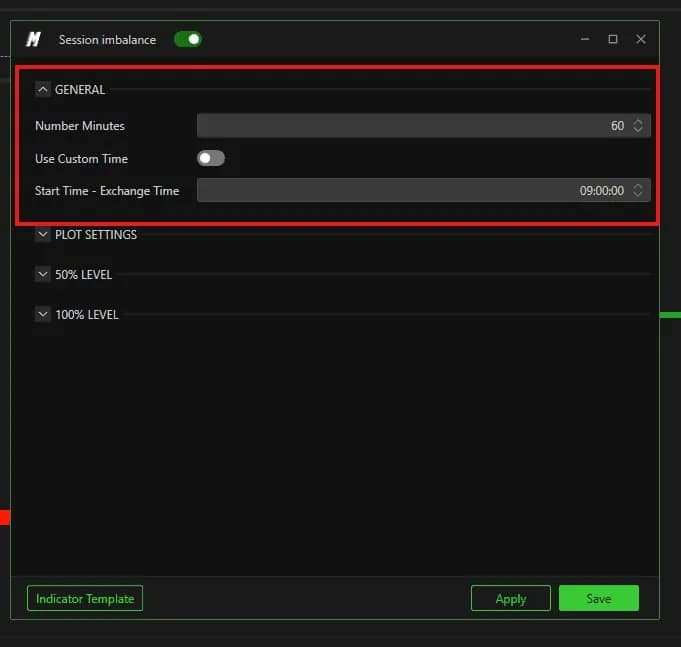
Use Custom Time, off by default, lets you set the session start yourself, and Start Time - Exchange Time expects that hour in exchange time, not your computer's clock or your chart's display time zone. The field arrives at 09:00:00, which suits a European session. For ES, NQ or MNQ, the window you want is the first hour after the 9:30 New York cash open.
The indicator never warns you when the start is wrong. It simply draws a perfect Initial Balance over a window no one is trading.
How far the lines run
The PLOT SETTINGS section controls colors, style and, above all, how long each line stays on the chart. High color is purple, Mid color olive and Low color green, with Line width 1, Line style Dash and Text size 11.00. Keep IB_M visibly different from the two boundaries: it works as a mean-reversion level inside the range, not as an edge.
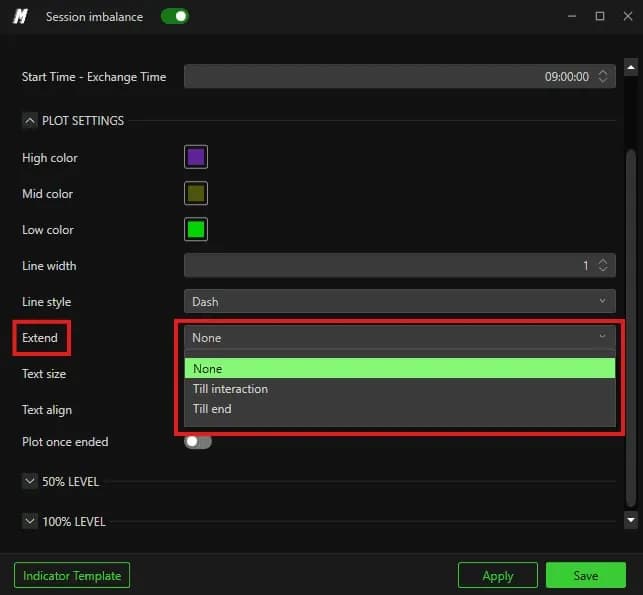
Extend arrives on None, so the lines stop when the initial window closes. Till end runs them to the end of the session, which suits a trader following one contract who wants the whole day's history in view. Till interaction stops each line at the first touch of price, and it is the most useful choice for reading: you see at a glance which levels have already been consumed and which are still untested. Plot once ended, off by default, decides whether the levels show while the window builds or only once it has closed.
The 50% and 100% extensions: targets, not entries
The two extensions are projections of the initial range beyond its boundaries, and they are there to take profit, not to open a trade. Each has its own section with an Enabled switch and a color, olive for 50% and yellow for 100%, and both ship enabled.
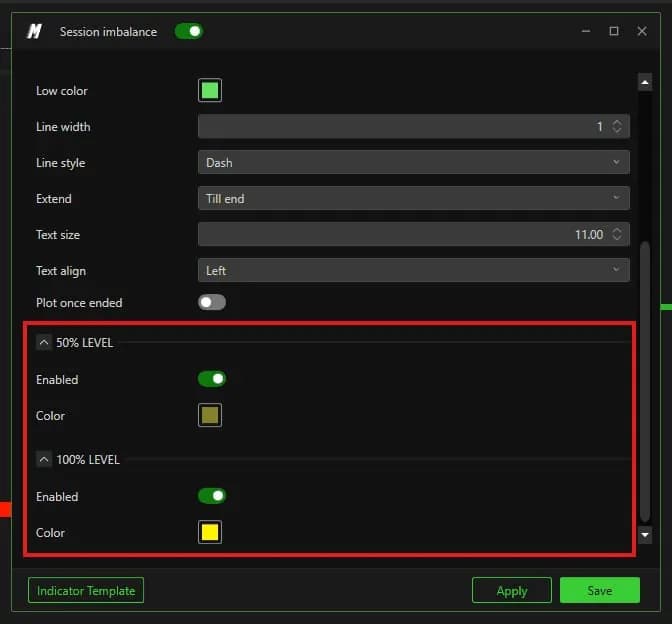
Because they arrive switched on, the real decision is whether to turn them off. If you do not trade Initial Balance breakouts, hide them: four extra lines on a chart that already carries VWAP and a profile end up hiding price.
Reading it in a real session
The most useful moment is the retest after a break, not the break itself. Take a hypothetical ES session. The first hour builds an Initial Balance from 7,440 to 7,480, 40 points wide, so IB_M sits at 7,460, the 50% extension at 7,500 and the 100% extension at 7,520.
At 11:00 New York, price breaks above 7,480 and runs to 7,492. Twenty minutes later it comes back to test 7,480 from above. The footprint shows sellers hitting the bid into the level, with volume building and price refusing to trade below 7,479. That is absorption on the retest, and it gives the trade: a long at 7,481, a stop at 7,476, 5 points under the entry, and the 50% extension at 7,500 as the first target. On ES the stop is 250 dollars per contract, on MES 25 dollars.
If the retest fails instead, and price trades back inside the range with sellers in control, the read changes: the break was rejected, and IB_M at 7,460 becomes the natural target for a rotation back into the range.
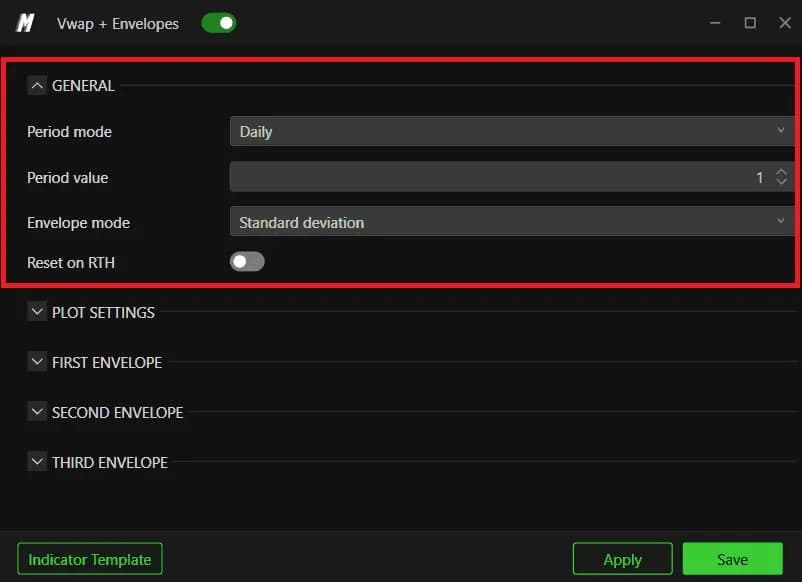
Session Imbalance gives the frame; other tools tell you where the market accepted price inside it. VWAP and its envelopes, covered in VWAP envelopes and ADR Target, sit naturally beside it in the same family of indicators.
The volume profile adds the third view: where the session built value. See Deep Profile Values for the POC and value area.
The settings that matter
Six settings shape the indicator, and only one of them can make it wrong rather than merely less readable: the start time.
| Setting | Default | What it changes |
|---|---|---|
| Number Minutes | 60 | Length of the initial window. Keep the common convention |
| Use Custom Time | Off | Turn it on to set the session start yourself |
| Start Time - Exchange Time | 09:00:00 | The start of the window, in exchange time. Fix it for US contracts |
| Extend | None | Till interaction shows consumed levels, Till end runs to the close |
| Plot once ended | Off | Shows the levels while the window builds, or only once it has closed |
| 50% LEVEL and 100% LEVEL | Enabled | Measured targets after a break. Hide them if you do not trade breakouts |
On a prop firm evaluation, the indicator earns its place through defined risk. A boundary gives a clean invalidation just beyond it, so the stop is set by the structure, not by hope, and the size follows from the stop. One caution: on a day when the main release lands in the afternoon, such as an FOMC decision, the first hour describes little and its boundaries have less reason to hold. Plans and data costs for DeepDomOFF are on our platform page.
Firms that run DeepCharts