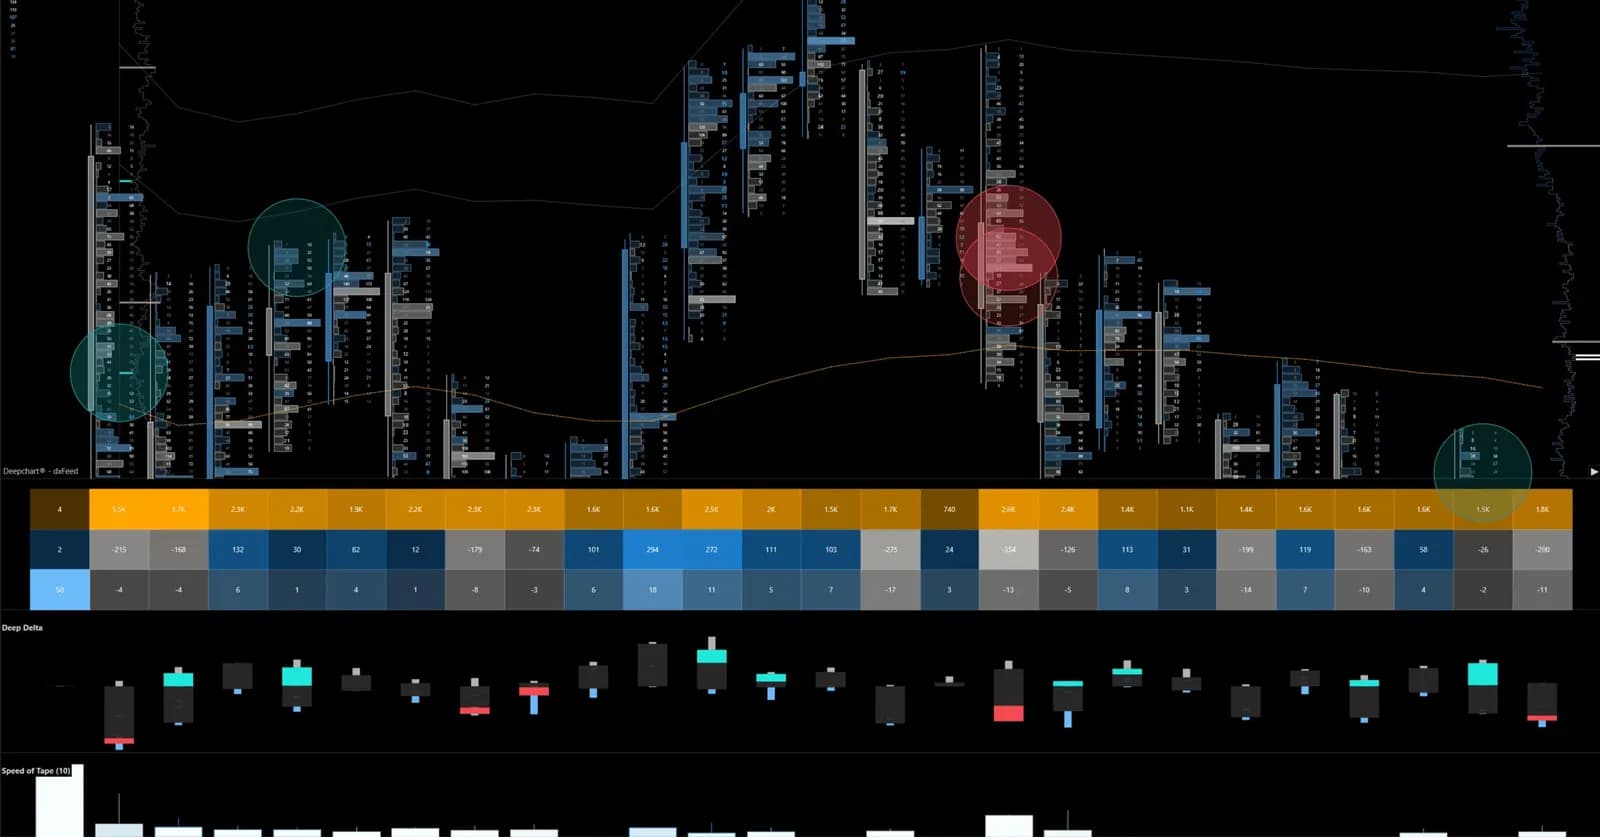
VWAP envelopes and ADR Target: frame the trading day
VWAP says where value is, the envelopes how far price has stretched, ADR Target how much of the usual day is spent: the settings that matter and how to read them.
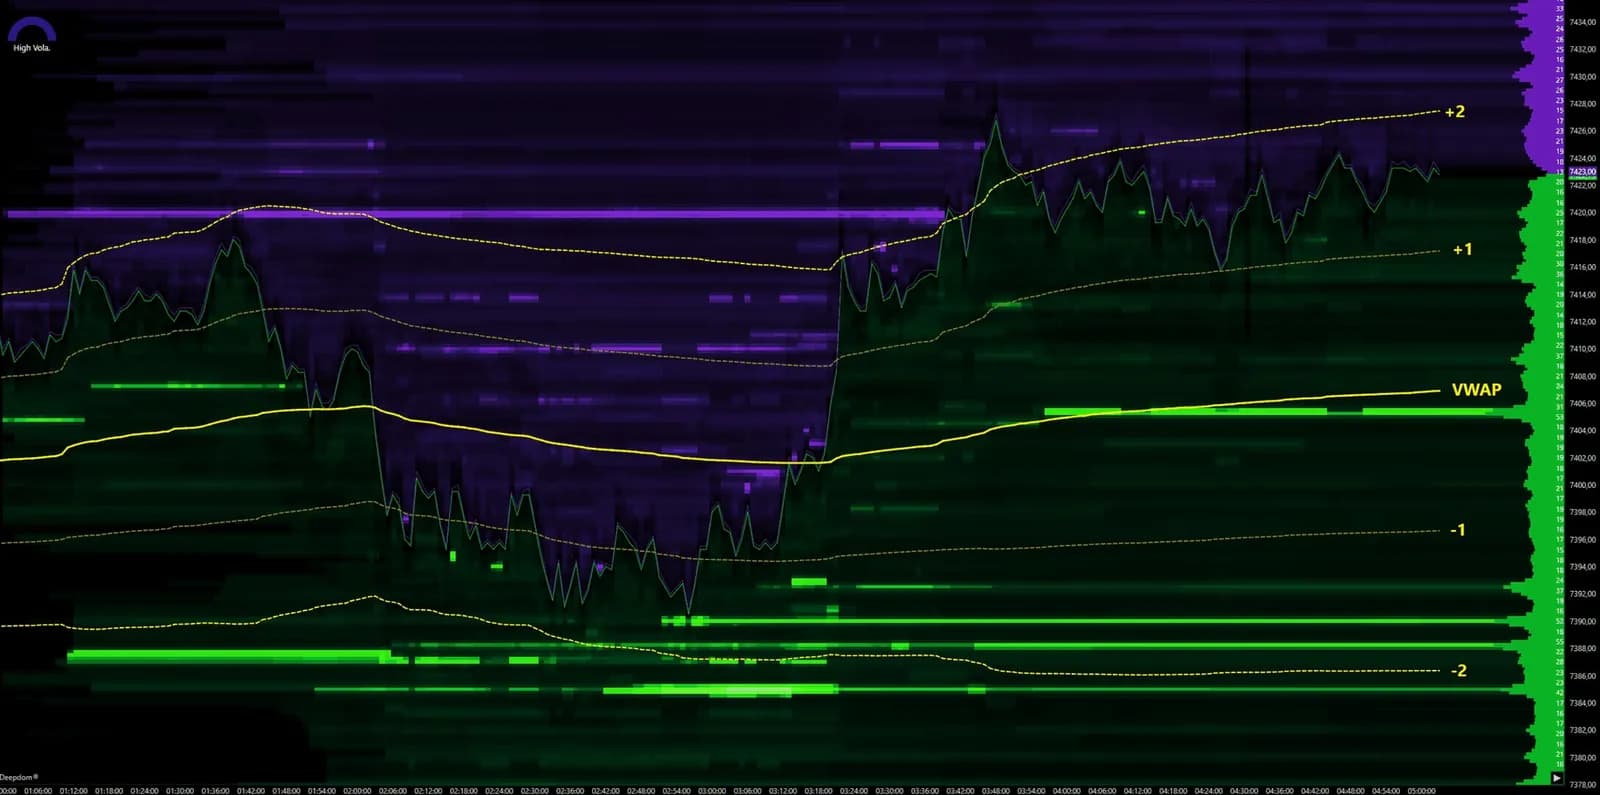
Before you read a single footprint bar, two questions frame the session: where is the fair price of the day, and how much room does the day usually have? DeepChartsOFF answers them with two indicators. VWAP and its envelopes, in DeepDomOFF, give the volume-weighted average price and measure how far price has stretched from it. ADR Target projects the market's usual daily range onto the chart as labeled levels, so you know when a day has already done its normal work.
Neither one is a signal. Together they are the frame: the order flow tells you what is happening, the frame tells you where it is happening and whether there is distance left to run.
What VWAP and its envelopes show
VWAP is the average price of the day's trades weighted by their volume, so a 500-lot print counts 500 times more than a single contract. That makes it the price at which the market actually did business, which is why so many participants watch it. Above VWAP, buyers have paid up on average; below it, sellers have the upper hand.
The envelopes measure distance from that average. They are drawn as dashed lines labeled +1, +2, -1 and -2 at the right edge of the chart, with the solid VWAP line in the middle. The line carries the information. The envelopes tell you whether price is in its normal zone around the average or stretched into excess.
VWAP is switched on with the VWAP checkbox in the bar under the chart, and its settings open in a window titled Vwap + Envelopes.
Setting up VWAP: the period and the reset
Four settings in the GENERAL section decide what VWAP measures, and Reset on RTH is the one most traders miss.
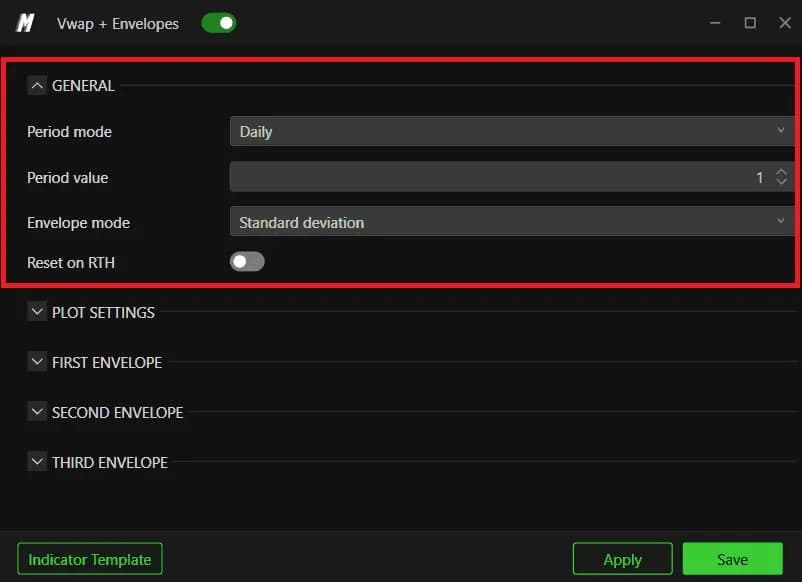
Period mode starts on Daily: the average restarts every session, and that is the reference the rest of the market watches. Minutes and Seconds compute it over a rolling window of Period value units instead, a fast-moving line suited to scalping but useless as a frame for the day. Orders advances the calculation by a number of orders rather than by the clock, so it follows the pace of activity.
Reset on RTH is off by default. Left off, VWAP includes the whole electronic session, overnight trading included. Switched on, it restarts at the regular session open, 9:30 New York on the equity index futures. On NQ and ES these are two different prices, and the one most day traders are watching is the second.
| Setting | Default | What it changes |
|---|---|---|
| Period mode | Daily | Daily anchors to the session; Minutes, Seconds and Orders use a rolling window |
| Period value | 1 | Length of the rolling window, for the non-Daily modes |
| Envelope mode | Standard deviation | Standard deviation follows volatility; Percentage sets a fixed width |
| Reset on RTH | Off | On: VWAP restarts at the regular session open instead of including overnight |
| First / Second / Third envelope | 1.00 on / 2.00 on / 3.00 off | Distance of each step, in standard deviations |
| Length type (ADR Target) | Daily | The bars the average range is computed from: Daily, Weekly or Monthly |
| Length (ADR Target) | 1 on screen | How many past periods are averaged |
The envelopes: standard deviation, two steps to start
Standard deviation is the right Envelope mode for most traders, because the width of the envelopes follows the volatility the session is actually producing. A narrow band means a quiet market. A touch of the second envelope keeps the same meaning from one session to the next. Percentage draws a fixed width: calmer to look at, but it tells you less.
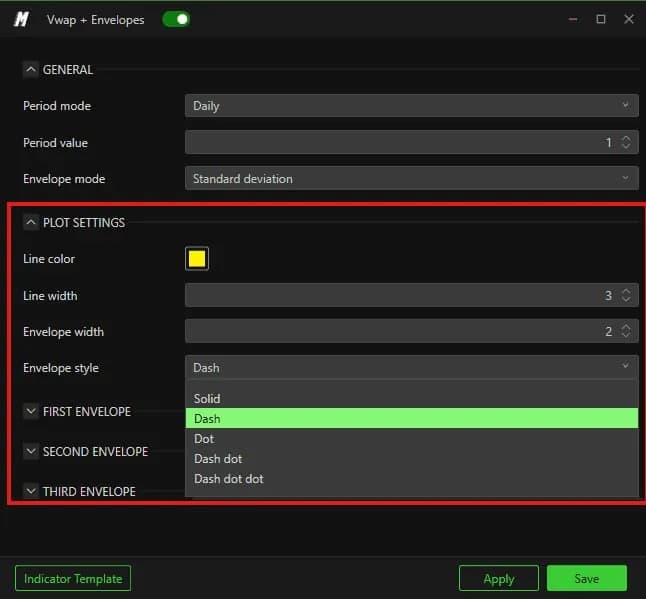
The PLOT SETTINGS section keeps the average and its envelopes visually apart on purpose: Line width at 3 for VWAP, Envelope width at 2 and Envelope style on Dash for the envelopes. Keep that difference, so your eye finds the average first.
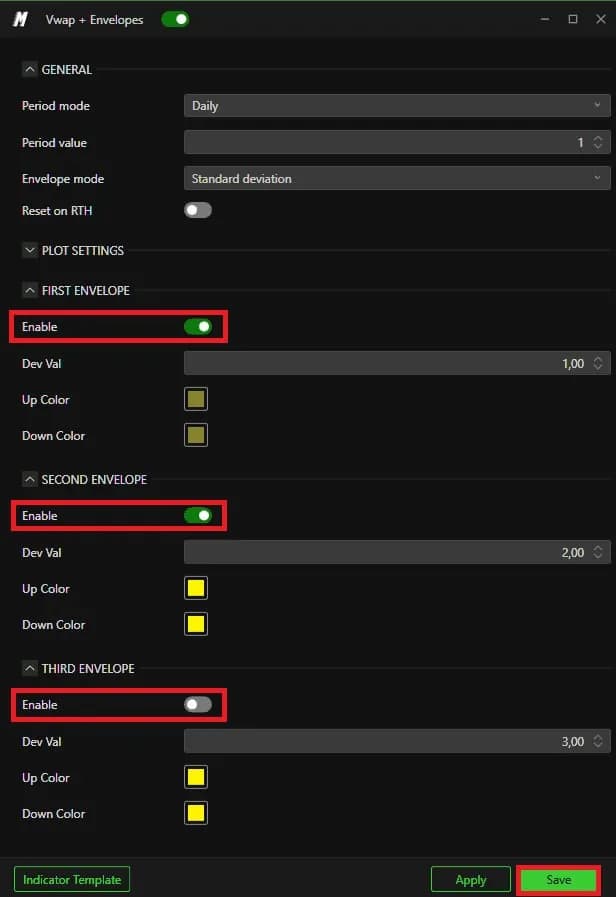
Each step has its own section with Enable, Dev Val and an Up Color and a Down Color, so an upside stretch and a downside stretch read differently at a glance. The defaults are well chosen: the first envelope on at 1.00, the second on at 2.00, the third at 3.00 left off. Keep the third off unless you specifically trade excesses: on a chart that already carries a heatmap and bubbles, seven lines around price is too many.
Reading VWAP in a live session
VWAP tells you which side is in control, and the envelopes tell you how stretched that control has become. Take a hypothetical NQ morning with Reset on RTH on.
Price opens above VWAP and holds above it through the first half hour. Pullbacks to the line attract buyers: the footprint shows sellers hitting the bid at VWAP without getting price through. That is the classic trend-day read, where VWAP acts as the area to join the move rather than fade it.
Later, price runs up to the +2 envelope. That is a context of excess, not a reversal signal. The decision comes from the order flow: if aggressive buying at +2 meets absorption and price stops making progress, the stretch has a reason to come back toward the average (see absorption vs exhaustion). If buyers keep lifting the offer and the tape speed stays high, the trend is simply strong.
A second VWAP adds depth. Run a session VWAP on Daily and a short one on Minutes on the same chart: price above both, or caught between them, describes two different situations, and the gap between the two lines is often more informative than either line alone. For the levels where volume built up during the session, pair VWAP with Deep Profile Values.
ADR Target: how far the day usually travels
ADR Target computes the average distance between high and low over a chosen number of periods, then draws labeled target levels on both sides of price: Scaling Tgt closest, then Primary Tgt, Secondary Tgt and Extension Tgt. It needs no special data feed, only enough loaded history to cover the length you choose.
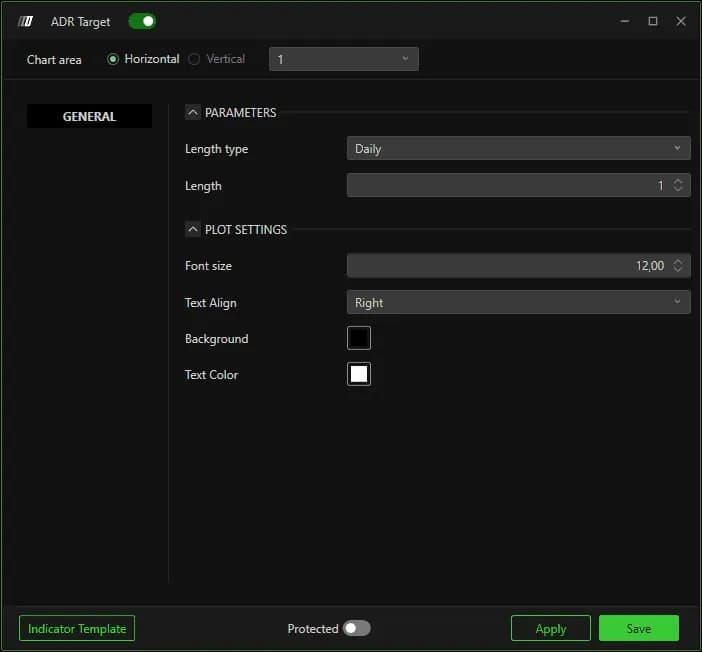
The two settings that matter sit under Parameters. Length type picks the bars: Daily for a day trader on NQ or ES, Weekly or Monthly for placing a swing inside the usual weekly or monthly range. Length sets how many periods are averaged. The screenshot shows 1, the previous session alone, which reacts to any unusual day. The help center uses ten sessions as its example: a longer length smooths out a CPI or FOMC day, at the cost of adapting more slowly. Under Plot Settings, a solid contrasting Background keeps the labels legible on a busy footprint.
Read the levels as range landmarks. The nearest ones are natural places to scale out; the furthest tell you a move is already stretched by the standard of recent days. Price can stall well before them, or run straight through on a trend day.
Putting the frame together
VWAP says where value is, the envelopes say how stretched price is around it, and ADR Target says how much of the usual day is already spent. When all three agree, the read is strong: price at +2, near Secondary Tgt, with absorption on the footprint, is a stretched market at the edge of its normal range.
On an evaluation, the ADR frame doubles as discipline. Once the day has covered its usual range, the best trades are often behind you, and forcing one more is how a good day turns into a daily-loss day. If that is a habit, write it into the platform's locks: see setting up the Risk Manager.