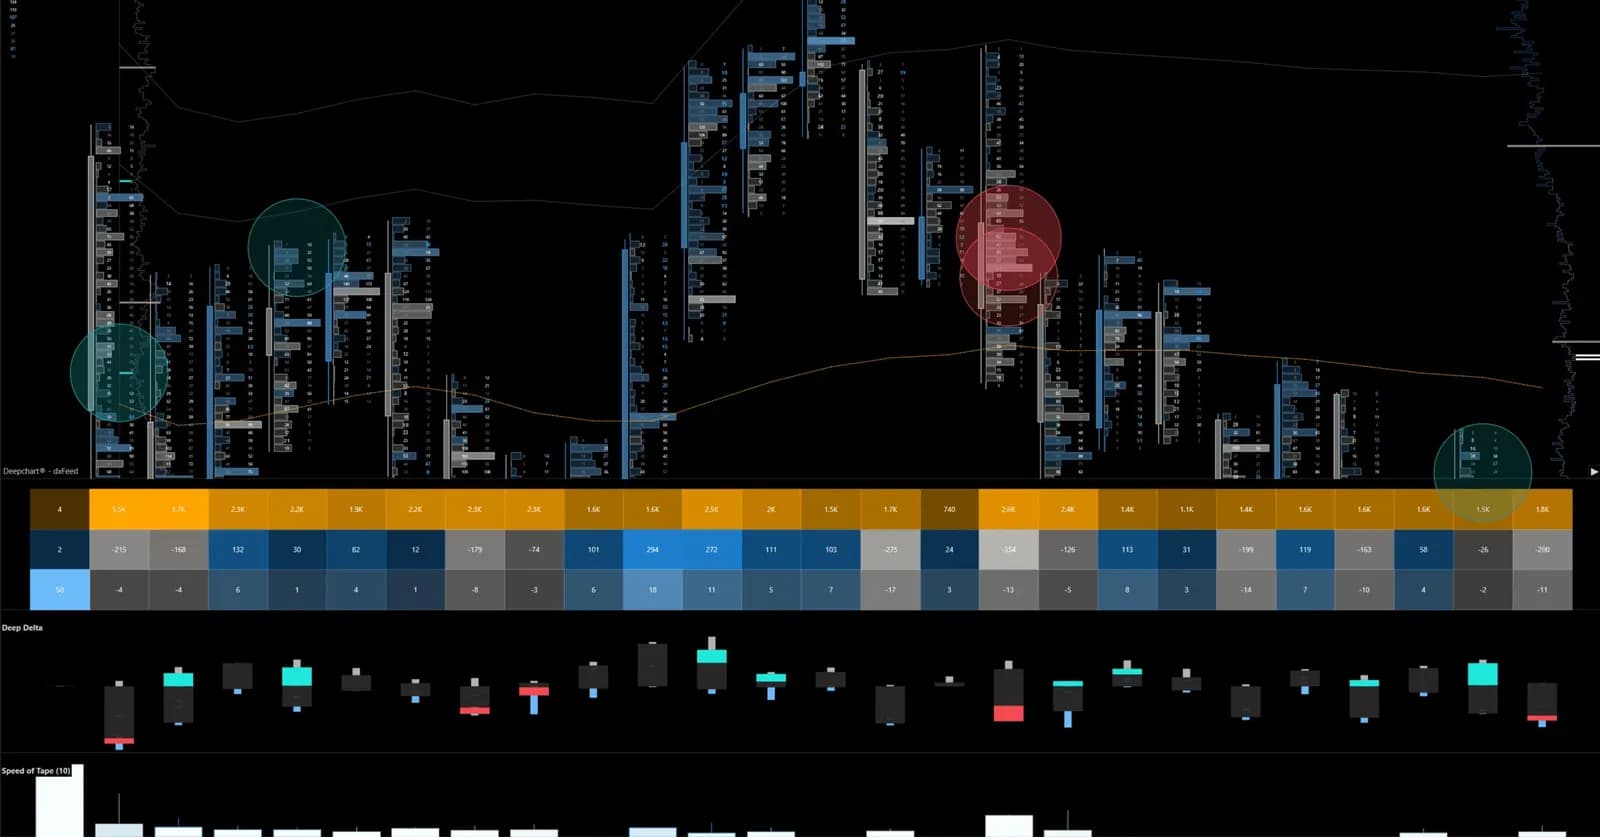
Deep Profile Values: volume profile levels, no bars
POC, value area, VWAP and its bands drawn as clean lines over the footprint: how to read them in a US session, and the period, data and session settings that matter.
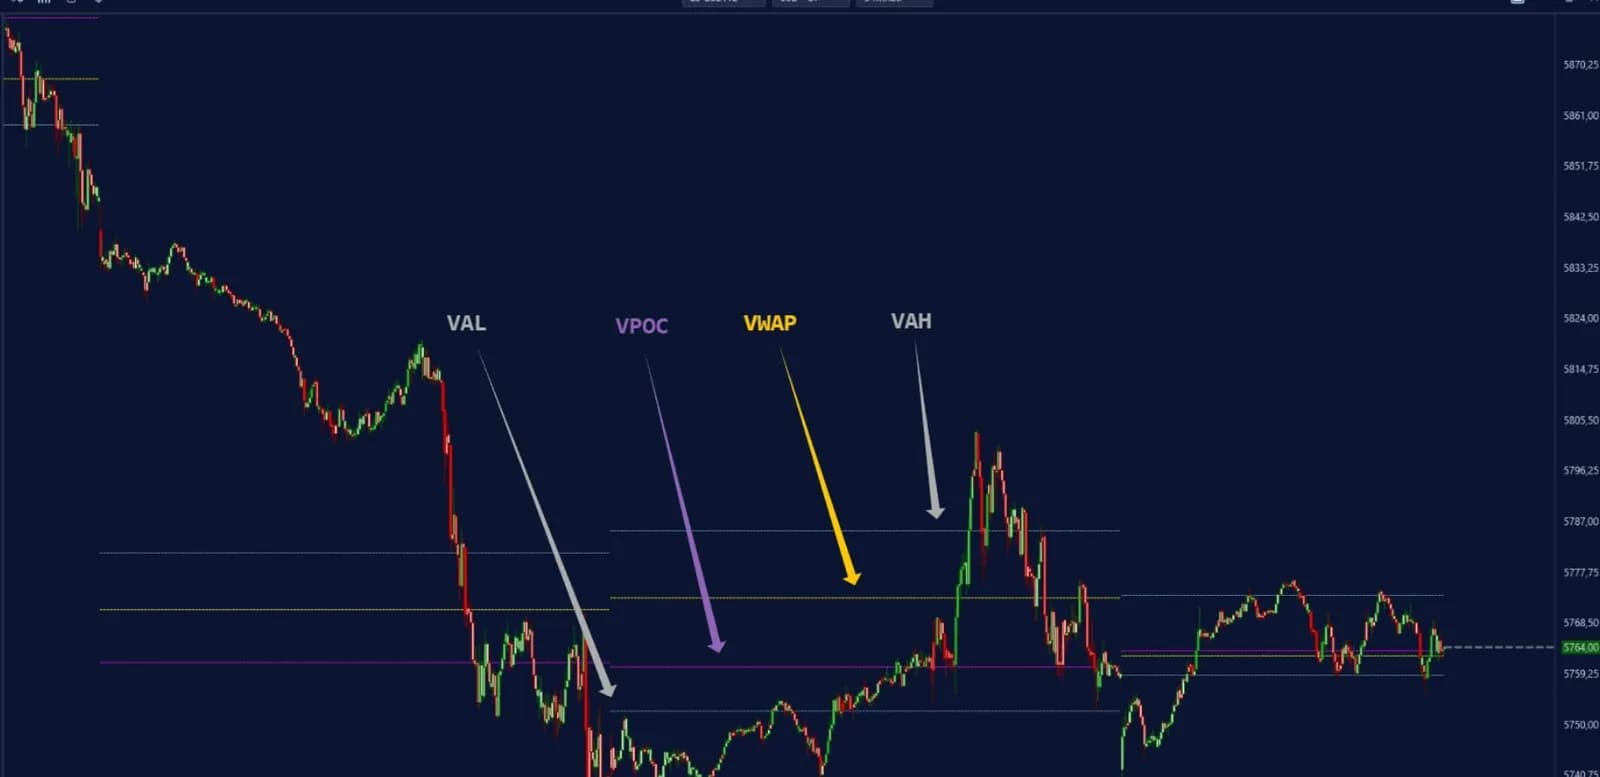
A volume profile answers one question: at which prices did the market actually trade? The answer is worth having on every intraday chart, but the histogram that usually carries it takes up a slice of the screen, and in a live session you only use a handful of its values. Deep Profile Values keeps those values and drops the drawing. It plots the point of control, the value area, VWAP with its bands, and the peaks and valleys of the distribution as clean lines, so they sit on top of a footprint without hiding it.
Below: what it draws, how to read its levels in a US session, and the few settings that decide whether the lines help or clutter.
What Deep Profile Values draws
Deep Profile Values plots the key levels of a volume-by-price profile without the histogram. The content is the same as a classic profile, computed from the same data; only the display changes. On the chart you get:
- The point of control (POC): the price where the most volume traded over the period.
- The value area: the price range holding a set share of the period's volume, 70% by default, bounded by a value area high and a value area low.
- VWAP: the volume-weighted average price, with optional standard deviation bands around it.
- Peaks and valleys: the zones of highest and lowest traded volume inside the profile.
- A summary block, optional, with volume and trade statistics next to the profile.
A full volume profile still shows the shape of the distribution better; this is the lighter tool when you want the prices themselves, carried forward.
Why levels without a histogram suit order flow
Levels without a histogram leave the screen to the footprint and the heatmap, where the actual decision is made. A volume profile tells you where the market found two-sided trade and where it moved through quickly. It does not tell you whether the next test of that price will hold. That answer comes from the flow at the moment of contact: absorption at the bid, aggression that stalls, a liquidity wall that stays or gets pulled.
The working method is simple: the levels are drawn in advance, the decision is taken in the flow. Yesterday's POC is just a price until you see how the footprint behaves when it gets tested. The POC is a reference the market often revisits, never a magnet that pulls price.
How to read the levels in a live session
The levels are read through one question: is price accepting value or rejecting it? Inside the value area the market is in balance, and its edges are decision points. Outside, the market is either testing a new price or about to come back.
Take a hypothetical NQ session. Yesterday's regular session built a value area from 30,000 to 30,120 with the POC at 30,060, and all three lines are extended into today. NQ opens above the value area high and drifts back to 30,120 in the first half hour. Two outcomes matter:
- Rejection: price touches 30,120, the footprint shows sellers hitting the bid without making progress, and price lifts away. The old value area high is acting as support, and the move above value is being accepted.
- Acceptance back inside: price trades through 30,120 and holds below it for several bars. The market is back in yesterday's value, and the POC at 30,060 becomes the next reference, with the value area low beyond it.
On an evaluation account, levels drawn before the open also give you stops that are decided before the trade, beyond the value edge you are leaning on rather than at a round number picked under pressure. The method for turning those ticks into a contract count is in position sizing for prop firm drawdown.
Choose the period and the data
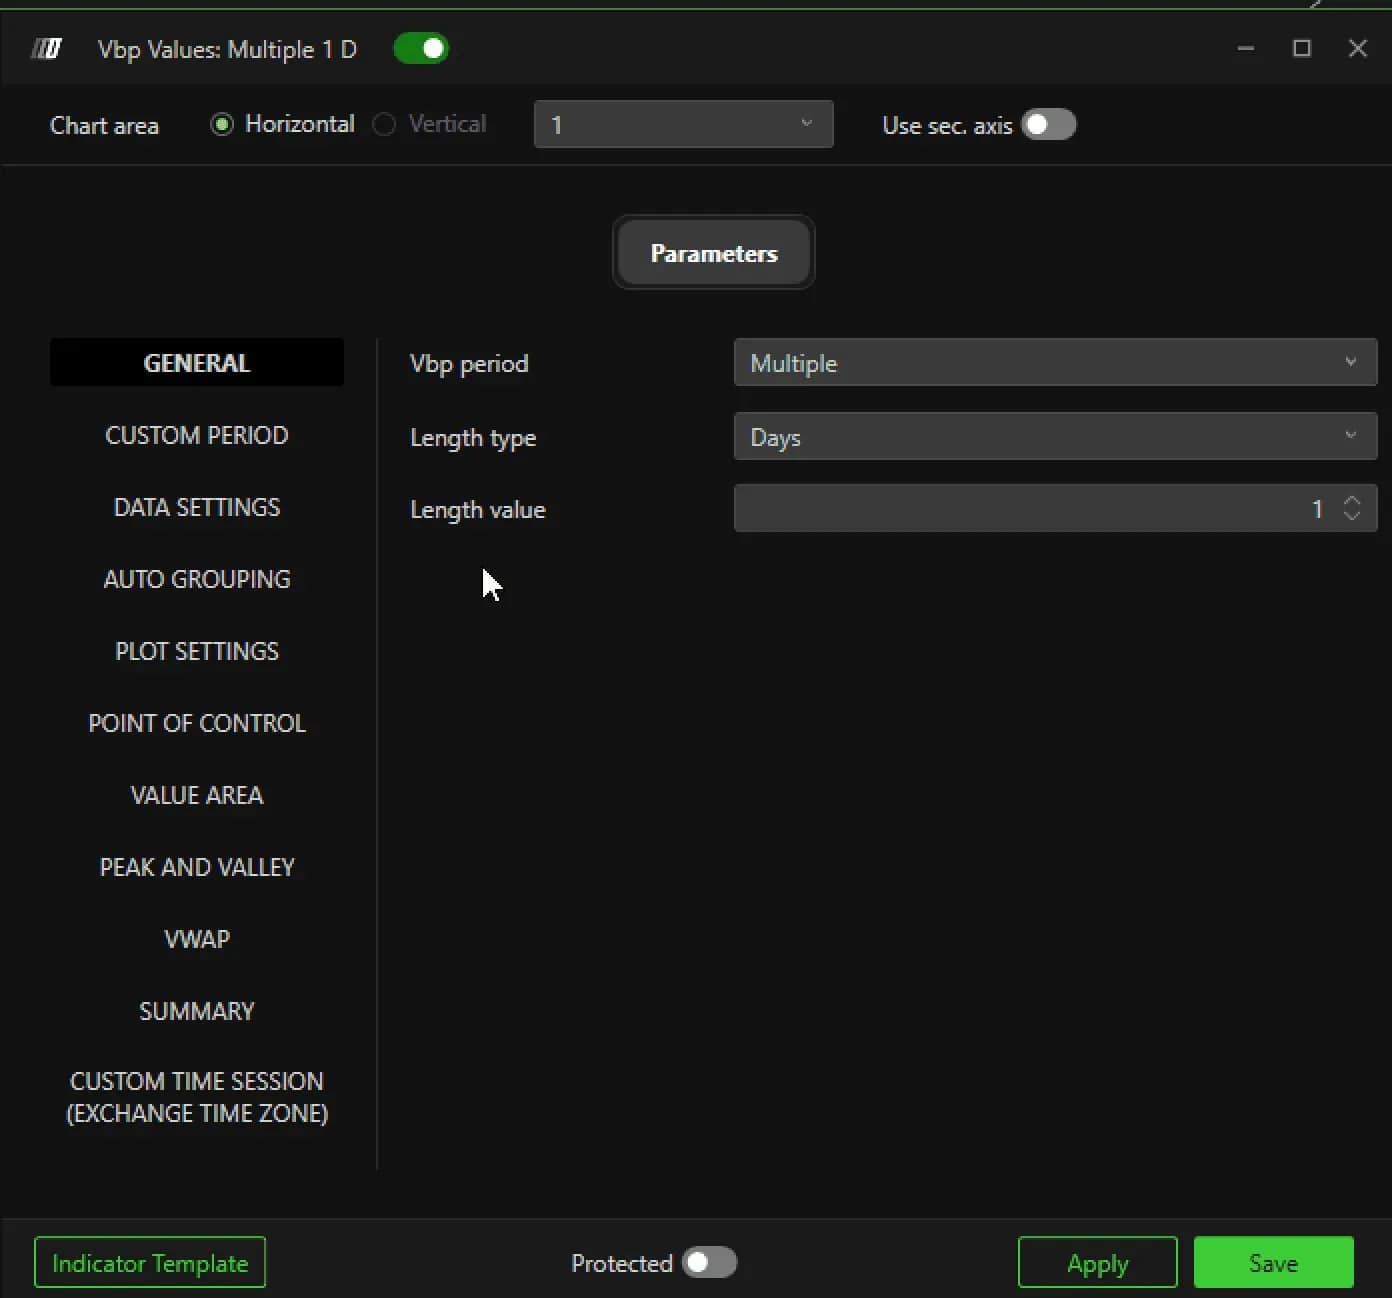
The period decides what the profile groups, and it is the first setting to get right. In the General tab, Vbp period offers four modes: Composite adds everything into one area, Multiple builds separate profiles side by side, Visible uses only what is on screen, and Custom starts from a date and time you set in the Custom Period tab. Length type (minutes, days, weeks, months or volume) and Length value then set the size of each block. The default shown is Multiple, Days, 1: one profile per day. Number of profile, in Plot Settings, decides how many of those days stay on the chart, 8 by default.
Input data, in Data Settings, chooses what the profile counts: Volume by default, or Order, Aggregate Trades, or Number of Trades. They are all valid, and they do not land on the same POC. Volume weighs the size traded at each price; Number of Trades weighs how many separate decisions were made there. Pick one and keep it, so today's levels compare with last week's. Filter min and Filter max, both at 0 by default, can exclude very small prints or abnormal spikes. Auto Grouping sets how many ticks merge into one profile level: Manual with Manual ticks at 1 keeps full tick resolution, Automatic lets a grouping factor decide.
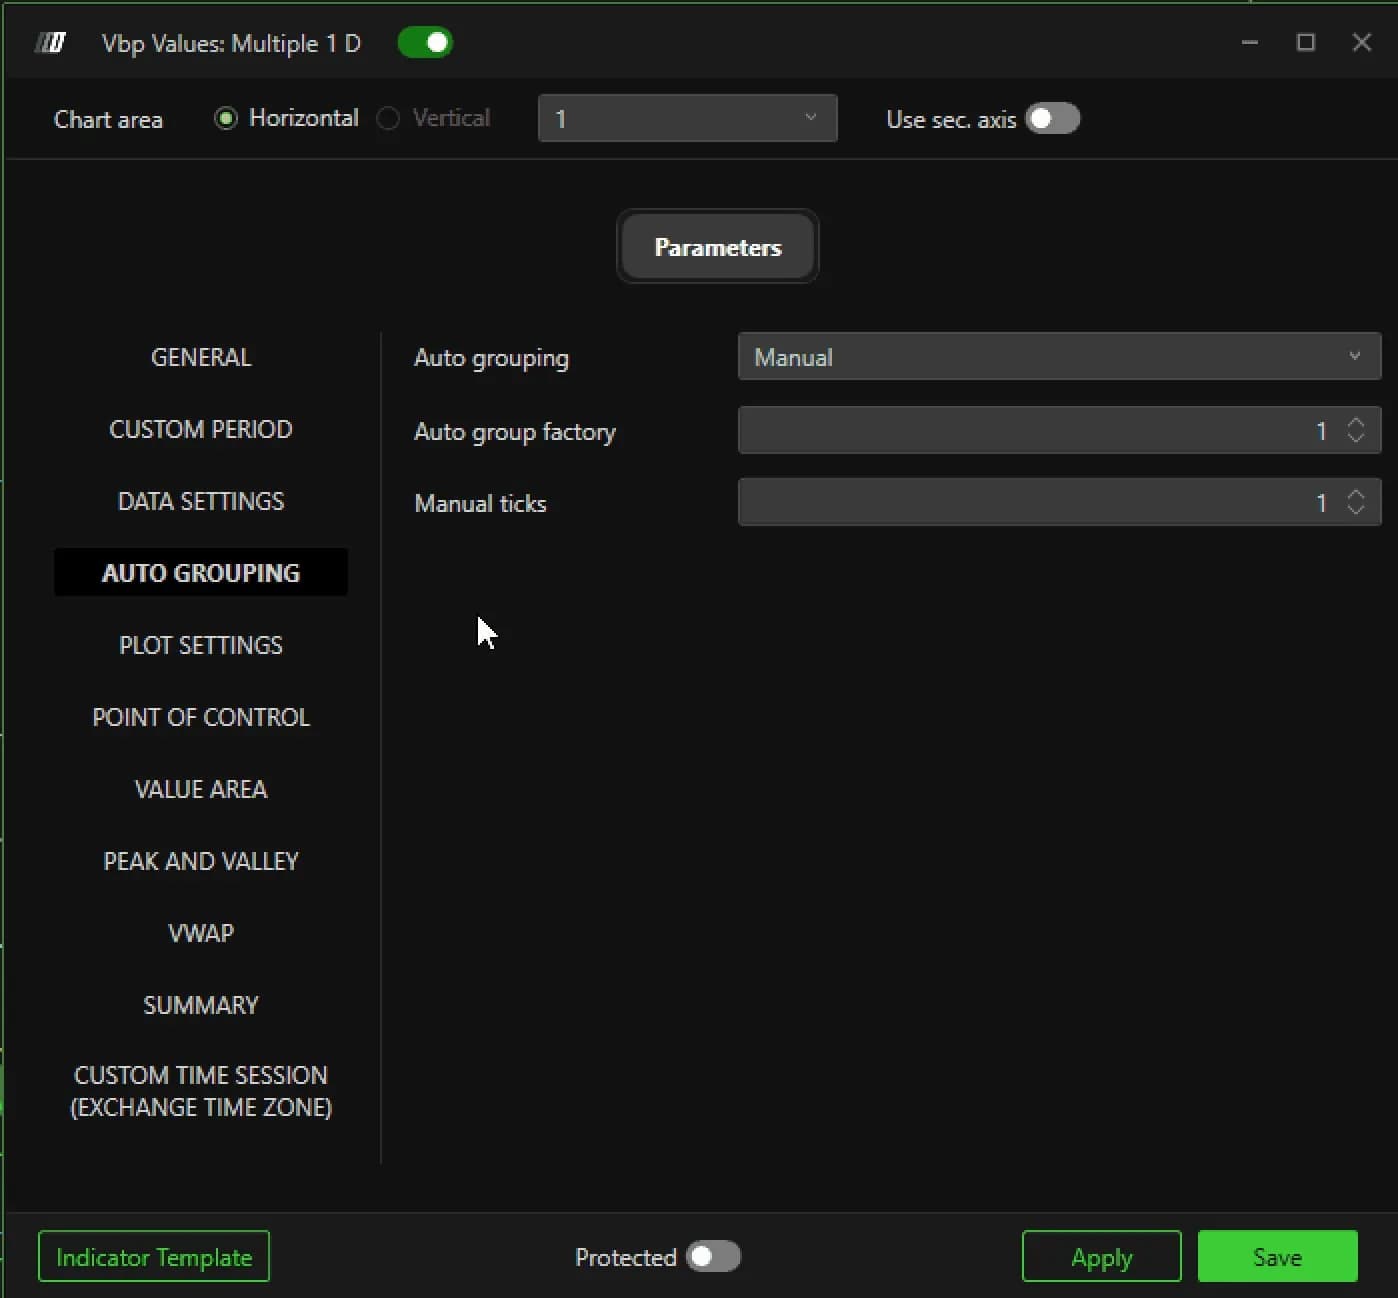
Set up the POC, value area and VWAP
The POC, value area and VWAP panels decide how each line is drawn and how long it stays on the chart. For the POC, Show line has three modes: Show for a static line, Develop for a line that recalculates as the period builds, and Extended offset for a highlighted zone. Extend Line controls persistence. Until interaction keeps a level on the chart until price trades back to it, which makes an untested POC from a previous session stand out at a glance.
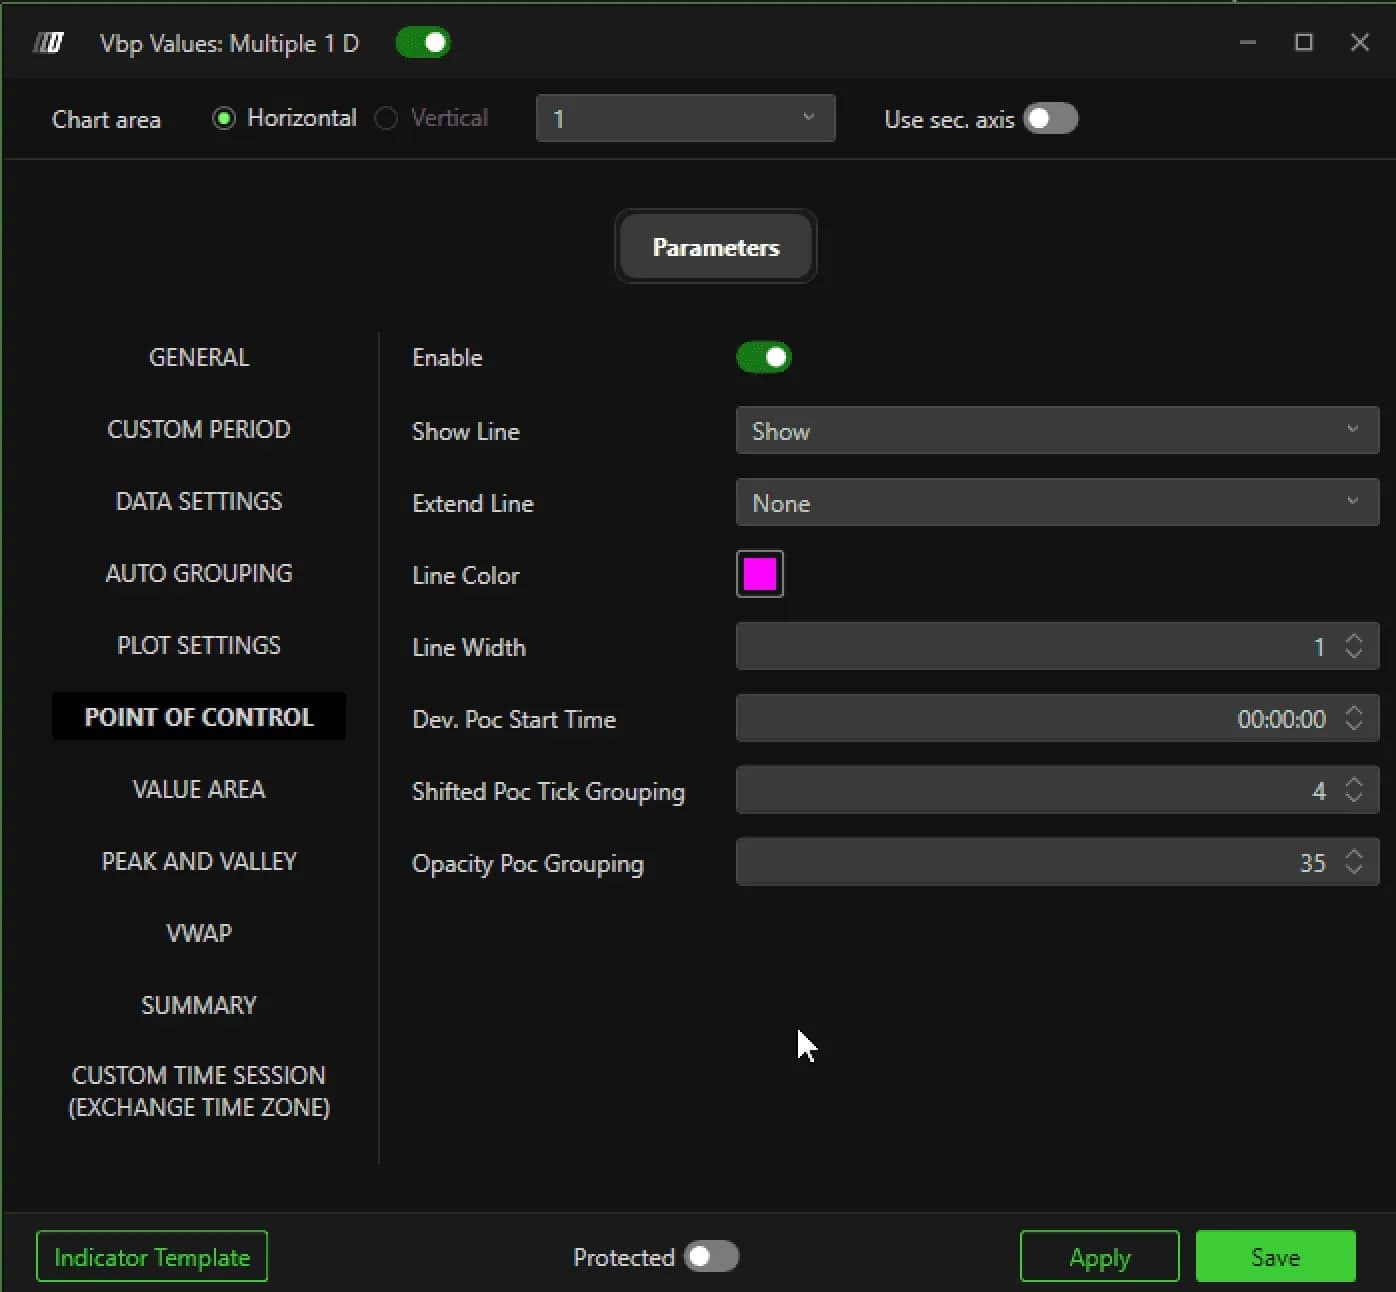
The value area uses % Value Area, 70 by default, with the same Develop and Extend options. The VWAP panel adds Dynamic VWAP, which updates the line in real time as volume comes in, and Enable bands for standard deviation envelopes around it.
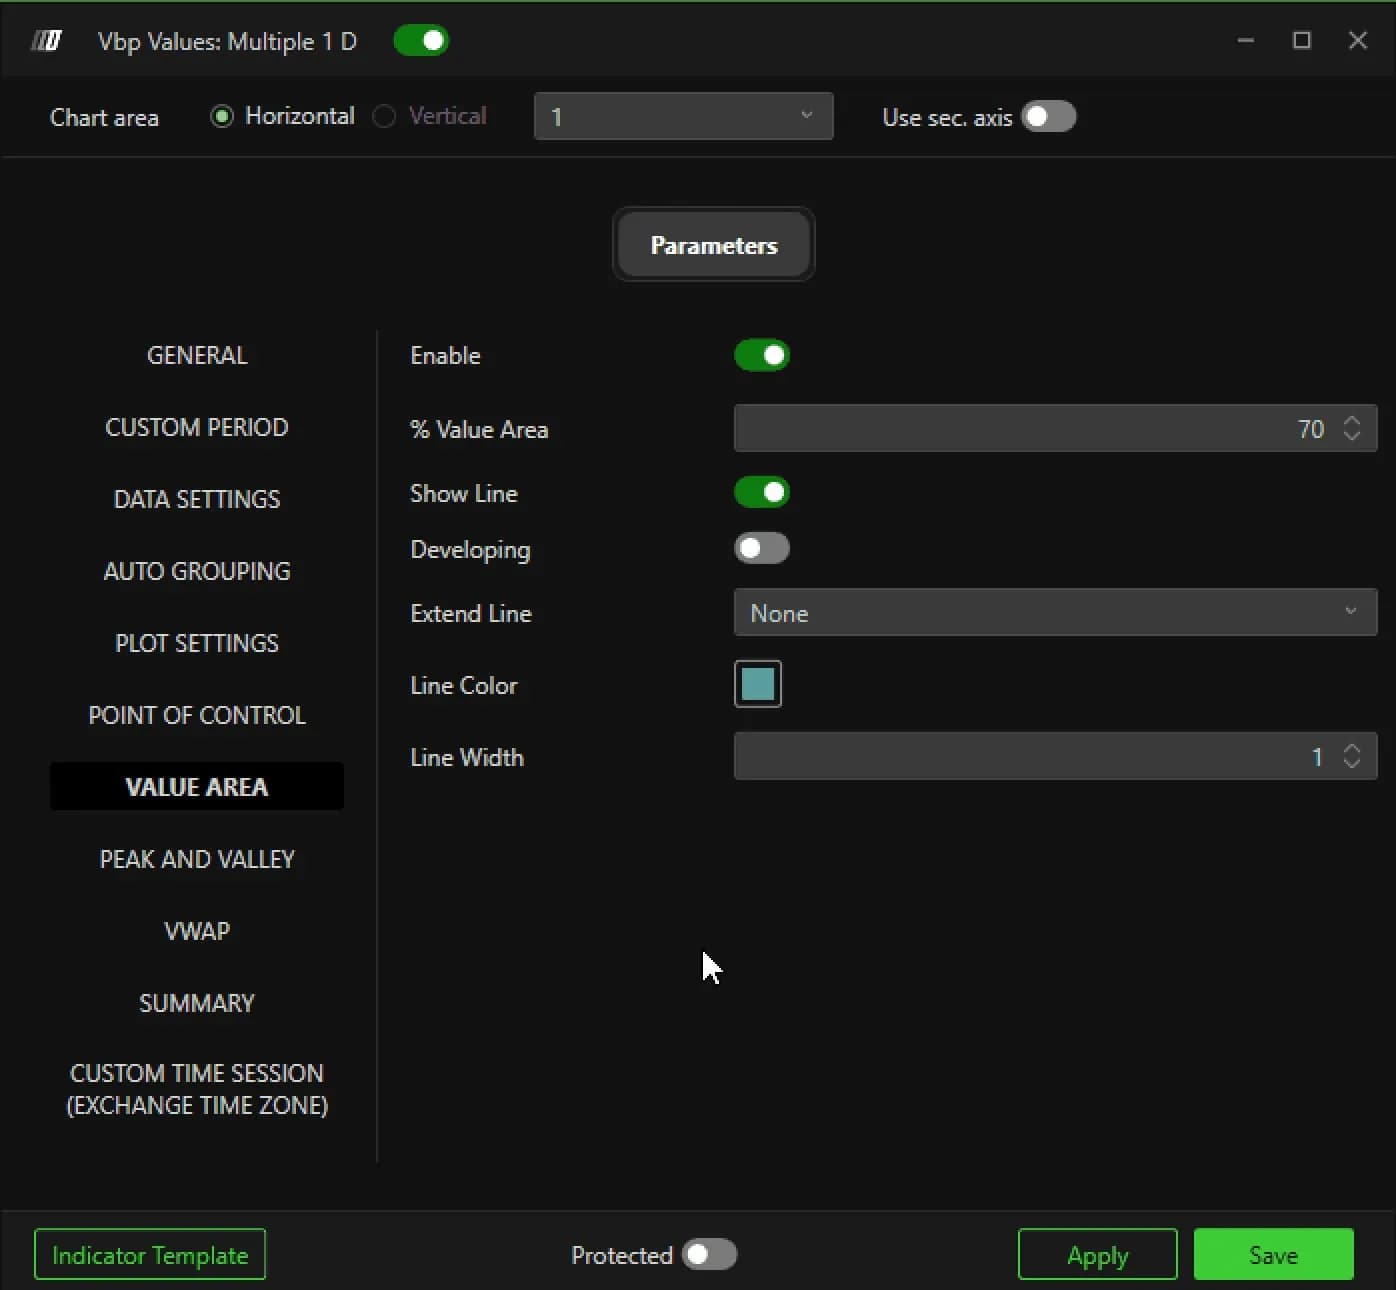
| Setting | Default | What it changes |
|---|---|---|
| Vbp period | Multiple | How the data is grouped: one area, separate periods, the visible screen or a custom range |
| Length type / Length value | Days / 1 | Size of each profile block |
| Number of profile | 8 | How many profiles stay on the chart at once |
| Input data | Volume | What the profile counts; changes where the POC lands |
| Show line (POC) | Show | Static line, developing line, or highlighted zone |
| Extend Line | None | Until interaction keeps a level visible until price retests it |
| % Value Area | 70 | Share of the volume that bounds the value area |
Filter the session hours
Custom Time Session limits the profile to the hours you actually trade, and it can move the levels more than any other setting. A profile built on the full 23-hour Globex day and one built on the regular US session rarely share the same POC. Filter mode offers None, Filter to keep only the session you define, or Split to cut the analysis into separate periods such as overnight and regular hours. Session start and Session end are always entered in the exchange's US time zone, whatever your computer's clock says.
Develop mode is worth knowing before you switch it on: a developing POC or value area moves all session long. That is the point when you follow how value builds, but if you are trying to trade a fixed level and the line keeps shifting, the static Show mode is the one you want. Set the period, the data and the session once, and you get three or four lines you trust, drawn before the open. If the platform is not installed yet, start with our installation guide.
Firms that run DeepCharts