Order flow trading, explained for futures traders
Footprint, delta, the DOM, the heatmap and volume profile: what each one reads, the two patterns to learn first, and one NQ trade built from the flow.
Order flow trading means reading the orders behind the price instead of the price alone: who is buying and who is selling, at which level, with what size, and whether they are getting what they want. A candle shows where the market went. Order flow shows how it got there, and whether the push behind the move is still there. It works especially well on futures, because every contract trades on one exchange and every trade is visible.
Why futures suit order flow
Order flow is only as good as its data, and futures give you complete data. An E-mini trades on a single venue, CME Globex, so the volume at each price and the order book you see are the whole market, not one broker's slice of it. Spot forex has no central exchange, and its "volume" is a broker's own tick count; crypto flow is split across dozens of exchanges. That is why order flow traders gather on NQ, ES, CL and GC, and why so many of them trade through futures prop firms.
The four questions order flow answers
Every order flow tool answers one of four questions:
| Question | Where you read it |
|---|---|
| Who was aggressive at each price? | Footprint chart: volume at the bid and at the ask |
| Who won the bar or the session? | Delta and cumulative delta (CVD) |
| Where are the resting orders? | DOM and liquidity heatmap |
| Where did the market accept value? | Volume profile: point of control, value area |
Each trade has two sides. One is a market order that crosses the spread, the aggressor; the other is a limit order resting in the book, the passive side. Order flow sorts volume by aggressor: buying at the ask is aggressive buying, selling at the bid is aggressive selling. Everything else is built on that split.
Footprint charts
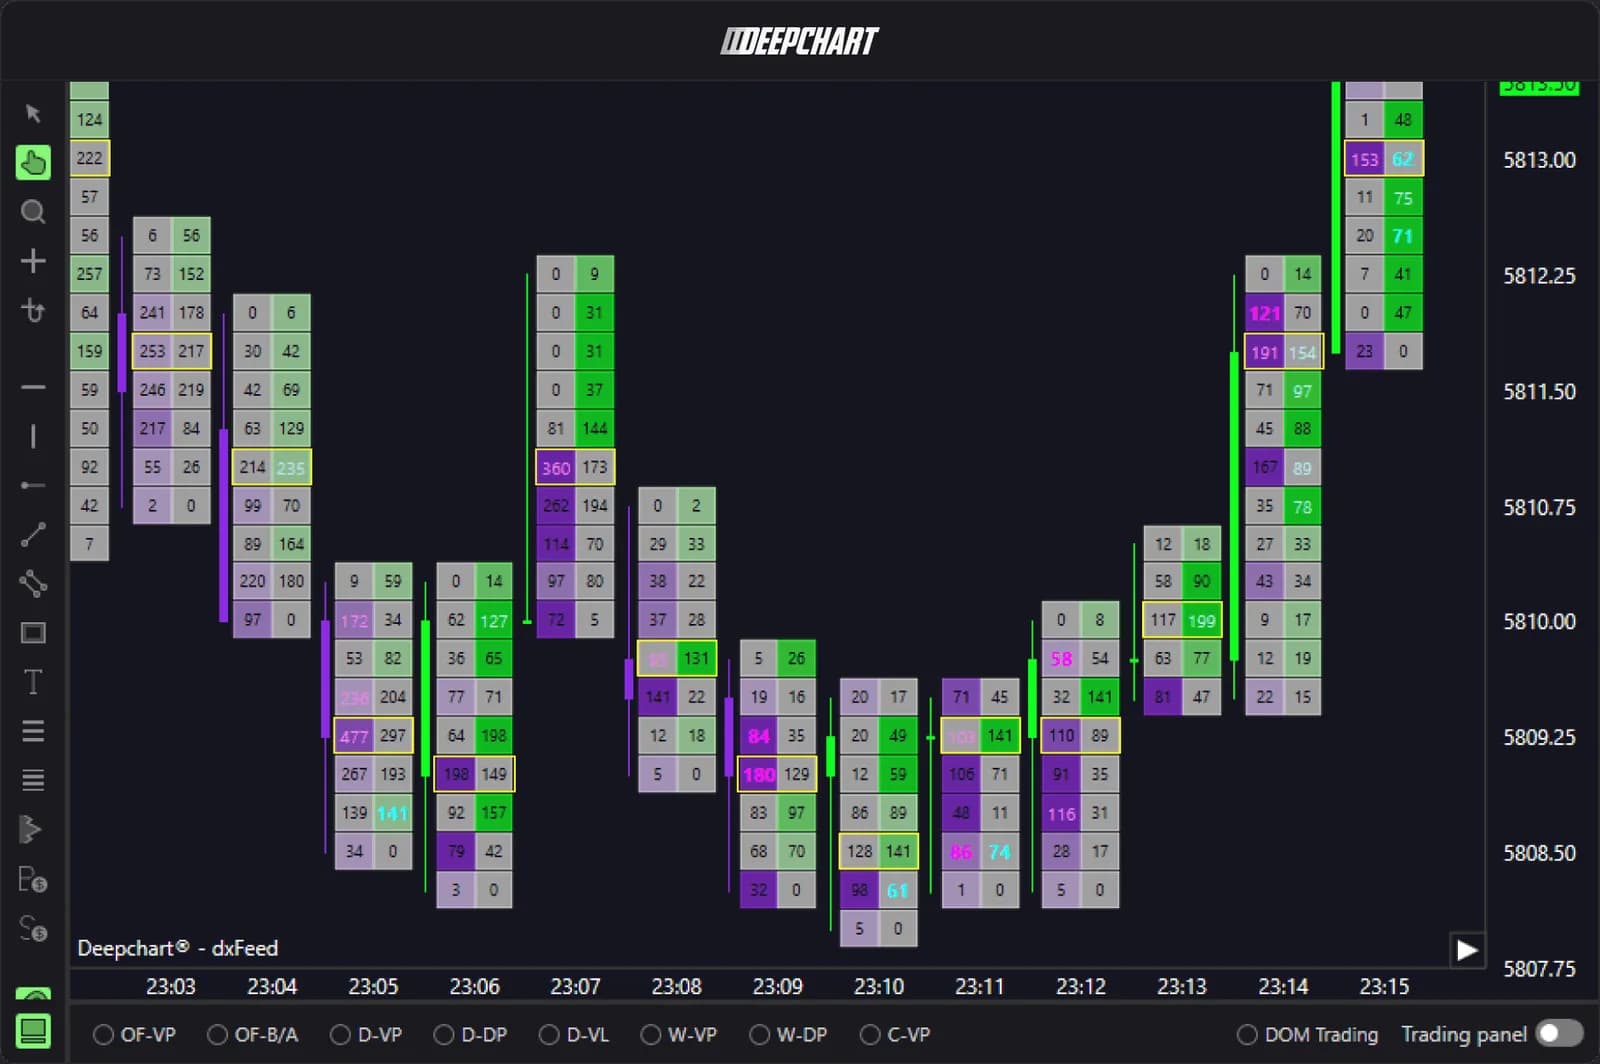
A footprint chart splits each candle into its prices and shows, at every price, the volume traded at the bid and at the ask. It is where you see an imbalance (one side trading three or four times the other on diagonal prices), a stack of imbalances that marks a real initiative, or a price where heavy selling printed and the price still did not fall. The full method, cell by cell, is in reading a footprint chart.
Delta and cumulative delta
Delta is aggressive buying minus aggressive selling, bar by bar; cumulative delta (CVD) adds it up over the session. Delta that agrees with the price is a move with fuel. Delta that disagrees, price up while CVD is flat or falling, is a divergence worth watching, not a signal on its own. The rules and their limits are in delta and cumulative delta.
The DOM and the liquidity heatmap
The DOM (depth of market) lists the resting limit orders at each price, live. A liquidity heatmap records that book over time, so you can see a wall of bids that has held for twenty minutes, one that was pulled the moment price came close, or liquidity that keeps refilling after each hit, the mark of an iceberg order. Reading the liquidity heatmap shows what is worth trusting and what is not.
Volume profile
A volume profile turns the session on its side: volume per price instead of volume per bar. The point of control (POC) is the most traded price, the value area holds about 70% of the session's volume, and low-volume nodes are prices the market crossed quickly and may cross quickly again. Profiles give the levels; the footprint and the book tell you what happens when price gets there.
Two patterns to learn first
The two patterns that pay first are absorption and exhaustion. Absorption: heavy aggressive volume hits a level and price does not move, because a passive player is taking all of it. Exhaustion: a move runs out of aggressive orders, volume dries up at the extreme, and the last buyers or sellers are trapped. Both stop a move, for opposite reasons, and both are traded the same way: wait for price to leave the level, then put the stop beyond it; absorption vs. exhaustion shows how to tell them apart bar by bar.
One trade, read from the flow
Here is a hypothetical NQ trade, built only from the flow. Price falls into the previous day's low.
- Footprint: three bars print heavy selling at the bid on the low, yet price stops making new lows. Delta is strongly negative on each bar: sellers are hitting, someone is absorbing.
- Heatmap: a large bid block sits two points lower and refills each time it is hit.
- CVD flattens while price holds.
- Entry long above the high of the absorption bar, stop 3 points under the bid block (12 ticks: 60 dollars on 1 NQ, 6 dollars on 1 MNQ), first target at the morning's point of control.
The flow gave a level, a reason and a precise place where the idea is wrong. That last part is what makes order flow fit a prop firm account.
Order flow on a prop firm account
Order flow suits evaluations because it gives tight, defined stops: the idea is wrong as soon as the absorbing side gives way. That lets you trade small, often, and stay inside a trailing drawdown. The stop in ticks is known before entry, so the size comes straight from the drawdown with the position size calculator.
Two practical points before you start. You need a platform that shows the footprint, the DOM and the heatmap on the firm's data feed, and the firm must allow that platform. DeepChartsOFF draws all four views and is listed by 3 of the firms on the board; the full list, with the feed each one uses, is in which prop firms accept it.

- Cheapest account
- $69
- Split
- 90%
- Drawdown
- End of day
- Data feed
- dxFeed
- Code
- —

- Cheapest account
- $105
- Split
- 90%
- Drawdown
- End of day
- Code
- Link applies it

- Cheapest account
- $44
- Split
- 80%
- Drawdown
- Static
- Data feed
- dxFeed
- Code
- OFF