Speed of Tape and Volume Bubbles: reading the pace
Speed of Tape shows when the market hurries, Volume Bubbles show who hit and how hard: how to read a climax or an impulse, and the settings that keep the chart clean.
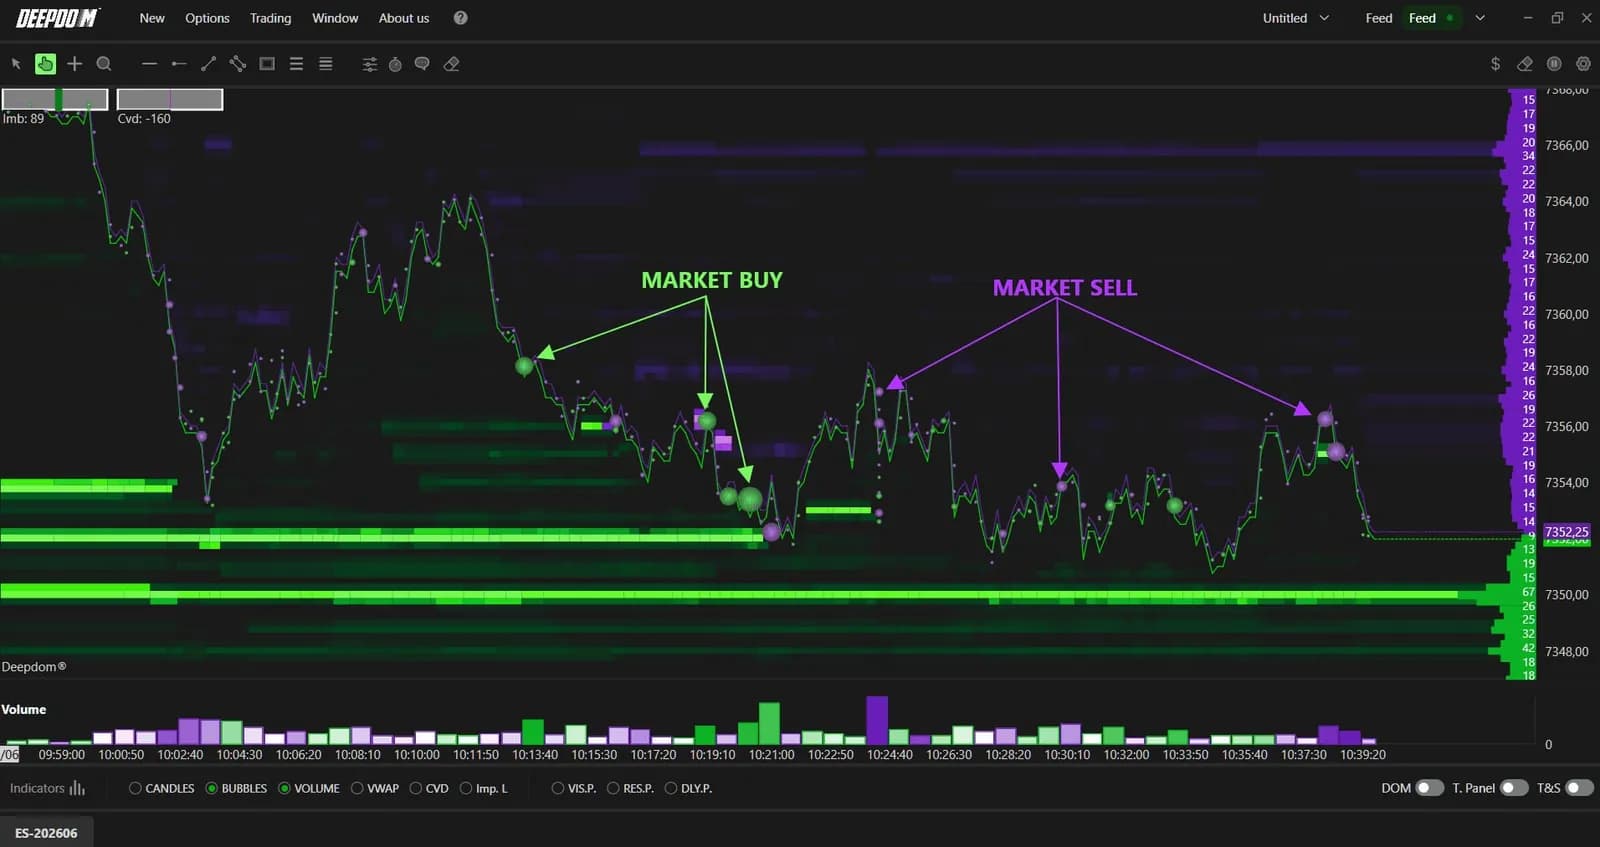
Volume tells you how much traded. It does not tell you how urgently, or where on the chart the size landed. DeepChartsOFF answers those two questions with two separate tools. Speed of Tape plots the pace of executions in a panel under the price, so you see the moment the market starts to hurry. Volume Bubbles, part of DeepDomOFF, draw every market order on the chart at its time and price, sized by the trade, so you see who hit and how hard.
Together they turn the tape into something you can read at a glance in the busiest minutes of the day, such as the US open on NQ and ES.
What Speed of Tape measures
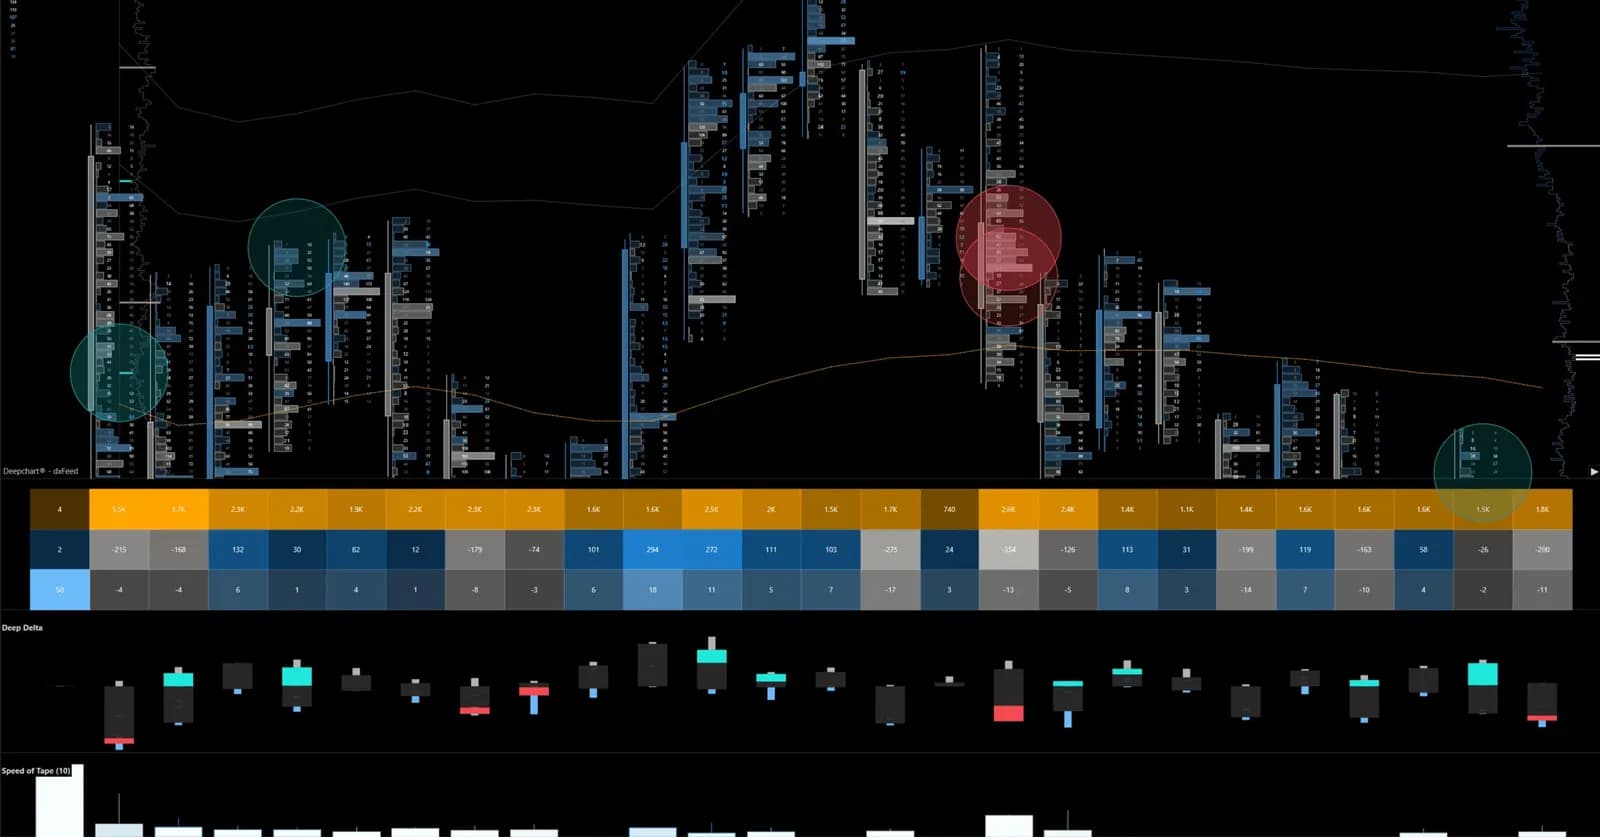
Speed of Tape measures how fast trades are executing over a rolling window of a few seconds, and colors each bar by the side that dominated it. It sits in its own panel under the chart as a vertical histogram. A tall bar means a lot of activity packed into a short time. Green or turquoise bars carry positive delta, buyers lifting the offer. Red or pink bars carry negative delta, sellers hitting the bid.
A five-minute bar of volume can come from a steady drip or from one violent burst in its last twenty seconds. Volume treats both the same; Speed of Tape separates them, because it only looks inside its short window. It is an urgency gauge, and urgency comes before both breakouts and climaxes.
How to read a speed spike in a live session
A speed spike tells you the market is in a hurry, not which way it will go next: the price reaction right after the spike gives the direction. Two outcomes are worth learning first.
The climax. NQ pushes into the overnight high in the first minutes after 9:30 New York. Speed of Tape fires its tallest green bars of the morning, a burst of market buys, and price prints one or two ticks above the high, then stalls. The bars collapse almost at once. The last wave of aggressive buyers paid up and got nothing for it. That is the profile of an exhaustion climax, and it often lines up with absorption on the footprint (see absorption vs exhaustion for how to tell the two apart).
The impulse. Same burst, same level, but price keeps stepping through the high while the bars stay tall. Speed sustained after the break says the aggressors are still finding liquidity to take. That is continuation, not a top.
The rule that follows: never trade the spike itself. Wait for the next few seconds of price and speed to tell you which of the two you are in.
Setting up Speed of Tape
The time window is the setting everything else depends on: Number of seconds, 10 by default, sets how much of the tape each bar summarizes. The rest of the settings shape what goes in and how it is drawn.
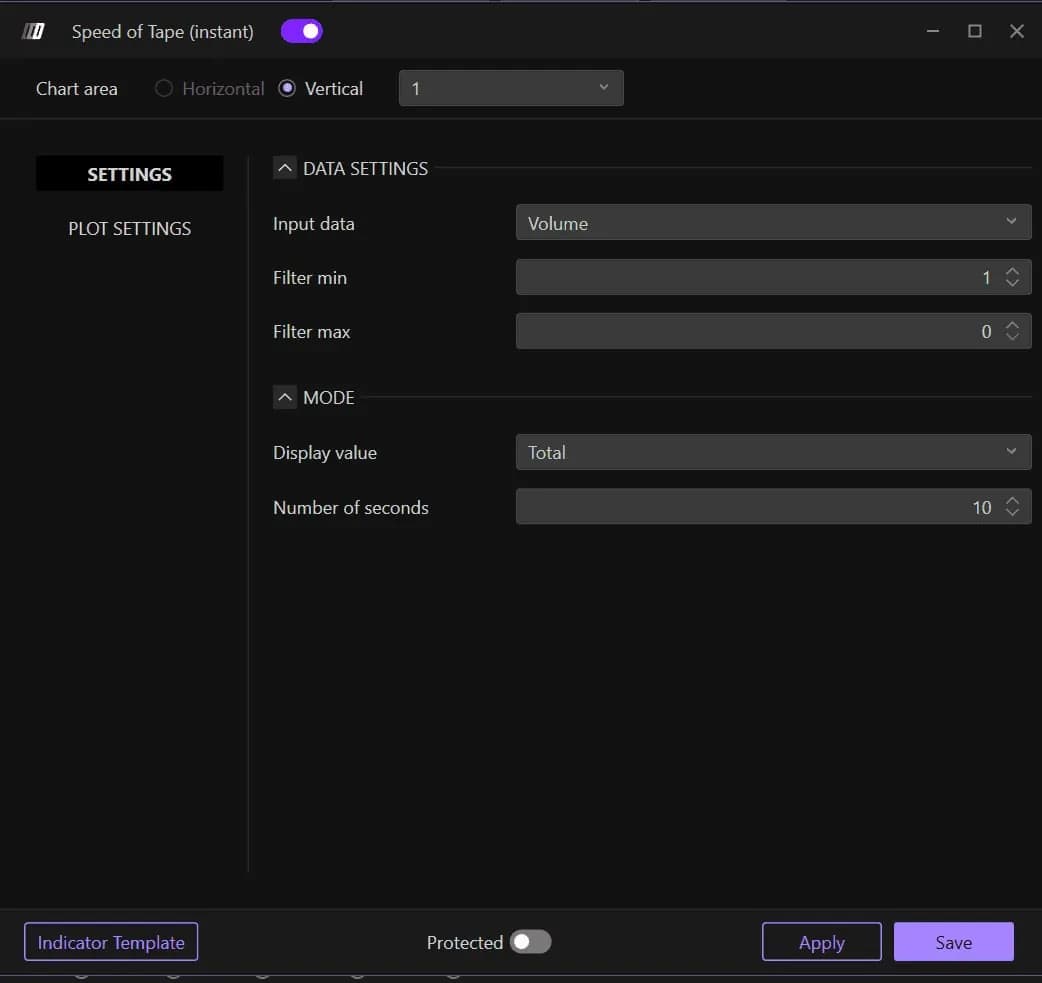
A shorter window, five to ten seconds, reacts faster and suits scalping on NQ or ES. A longer one, fifteen to thirty seconds, smooths the bars and suits slower trades. Match it to the instrument too: on a thin contract a five-second window holds too few trades to mean much, while on NQ at the open a thirty-second window blurs the burst you were waiting for.
| Setting | Default | What it changes |
|---|---|---|
| Input data | Volume | Volume counts contracts traded; Orders counts transactions instead |
| Filter min | 1 | The smallest trade that enters the calculation |
| Filter max | 0 | Upper bound on trade size; 0 means no limit, so every trade counts |
| Display value | Total | Sums all the window's activity into one measure |
| Number of seconds | 10 | Length of the rolling window: shorter reacts, longer smooths |
| Bars to show | 3 | How many recent bars stay visible, 1 to 10 depending on screen width |
| Plot reversed | Off | Flips the panel vertically; display only, no effect on the values |
Volume is the right input for most traders, because it measures the effort directly. Orders is a useful second read of the same acceleration, counting transactions rather than contracts.
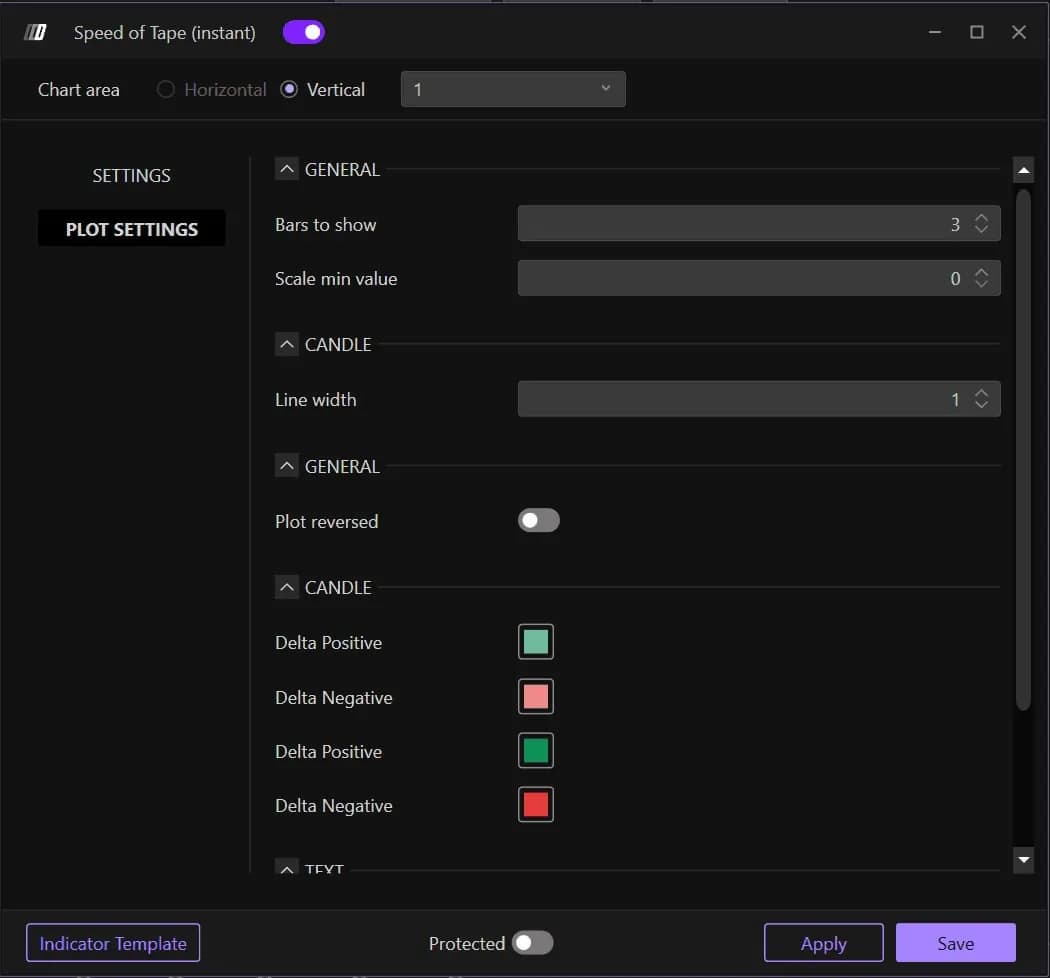
In Plot Settings, the two Delta Positive and two Delta Negative swatches give each side a main and a secondary shade, so you can tell a strong bar from an ordinary one at a glance.
What Volume Bubbles put on the chart
Volume Bubbles draw each market execution as a bubble at the exact time and price it happened, with a diameter that grows with the size of the trade. Green is a market buy, an execution at the ask. Purple is a market sell, an execution at the bid. They are switched on with the BUBBLES checkbox in the bar under the chart, and they need a DeepDomOFF license, because they are built from tick-by-tick data.
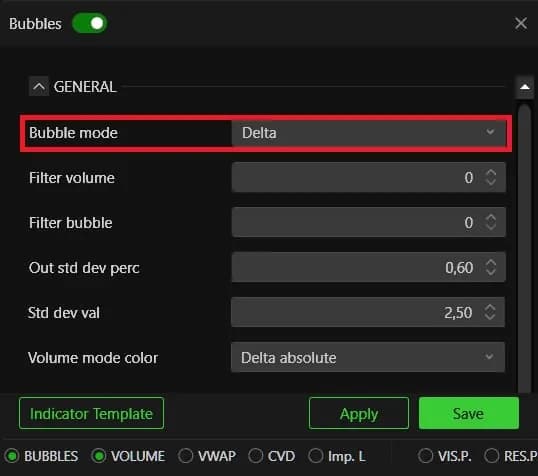
The first choice is Bubble mode, and it changes the question the bubbles answer. Delta, the default, nets buys against sells and shows only the balance. Ask Bid Split keeps both sides apart, so you see which side was aggressive at each price: the best mode to learn with. Volume ignores the side and shows size alone, which makes the exceptional prints stand out.
A large bubble is an execution, an agreement between two sides. It shows that an aggressor paid the price, not that price will keep going that way. A big green bubble that fails to move price is exactly what absorption looks like.
Keeping the bubbles readable on an active market
On NQ at the open the default bubbles can bury the chart, and four settings bring it back. Work through them in this order.
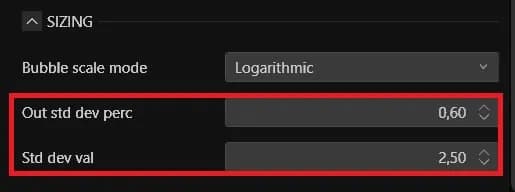
Filter first, in two steps. Filter volume and Filter bubble both start at 0 and do different jobs. Filter volume is a data threshold: trades below it are not counted. Filter bubble is a display threshold: the bubble is computed but not drawn. To clean up a crowded screen, raise Filter bubble. Raising Filter volume throws data away.
Scale the diameters honestly. On Linear, a block a hundred times larger than normal flow draws a bubble a hundred times wider and hides the price it traded at. SQRT compresses the gap without distorting the order of sizes, and is the best everyday choice. Logarithmic compresses further, for markets where a few huge blocks sit beside a thin flow.
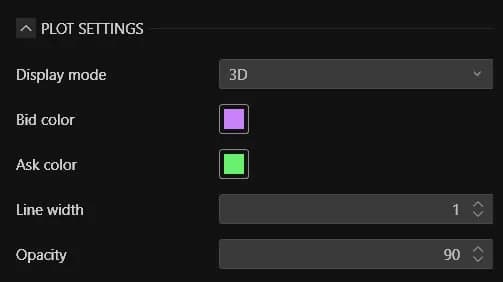
Draw in 2D, with lower opacity. Display mode offers 2D and 3D. 3D looks striking but makes two neighboring bubbles hard to compare, so 2D is the working mode. Opacity starts at 90, high enough that overlapping bubbles hide each other and the candles behind them.
Group by price when you want levels. Grouping mode, Automatic by default, can aggregate by Time or by Price. Grouping by price turns a cloud of prints into a map of the levels where volume really concentrated. Set Tick grouping mode to Fixed when you want to compare two sessions at the same step.
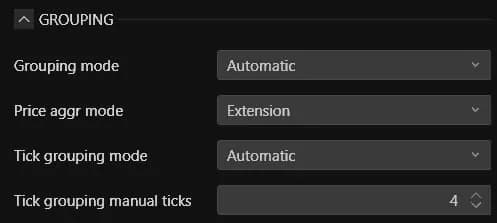
The Bubble size and Bubble grouping sliders in the chart toolbar adjust the same things live, without reopening the window.
Using both tools together
Speed of Tape tells you when to look, Volume Bubbles tell you what to look at. A tall bar in the speed panel flags the burst; the bubbles at that moment show whether it came from many small orders or from a few large prints, and on which side.
That cross-check is what keeps you out of the classic trap. A speed spike with large green bubbles stacked at the high and no progress in price points to buyers being absorbed. A spike with large green bubbles stepping higher price after price points to a real move. For the largest prints, Deep Trades and Big Trades classify the size further: see spotting large traders. For the passive side the aggressors are hitting, see Deep Liquidity Scan and Deep Reload.
On an evaluation, the speed panel has a second use: bursts are where fills get worse than planned, so a spike at your level is a good reason to let it pass before entering with a tight stop. Plans and the DeepDomOFF license are on our platform page.