Deep Liquidity Scan and Deep Reload: measure the book
Bid against ask as curves, fresh liquidity as bands: how two DeepDom indicators tell a defended level from a thinning book, with the settings that matter.
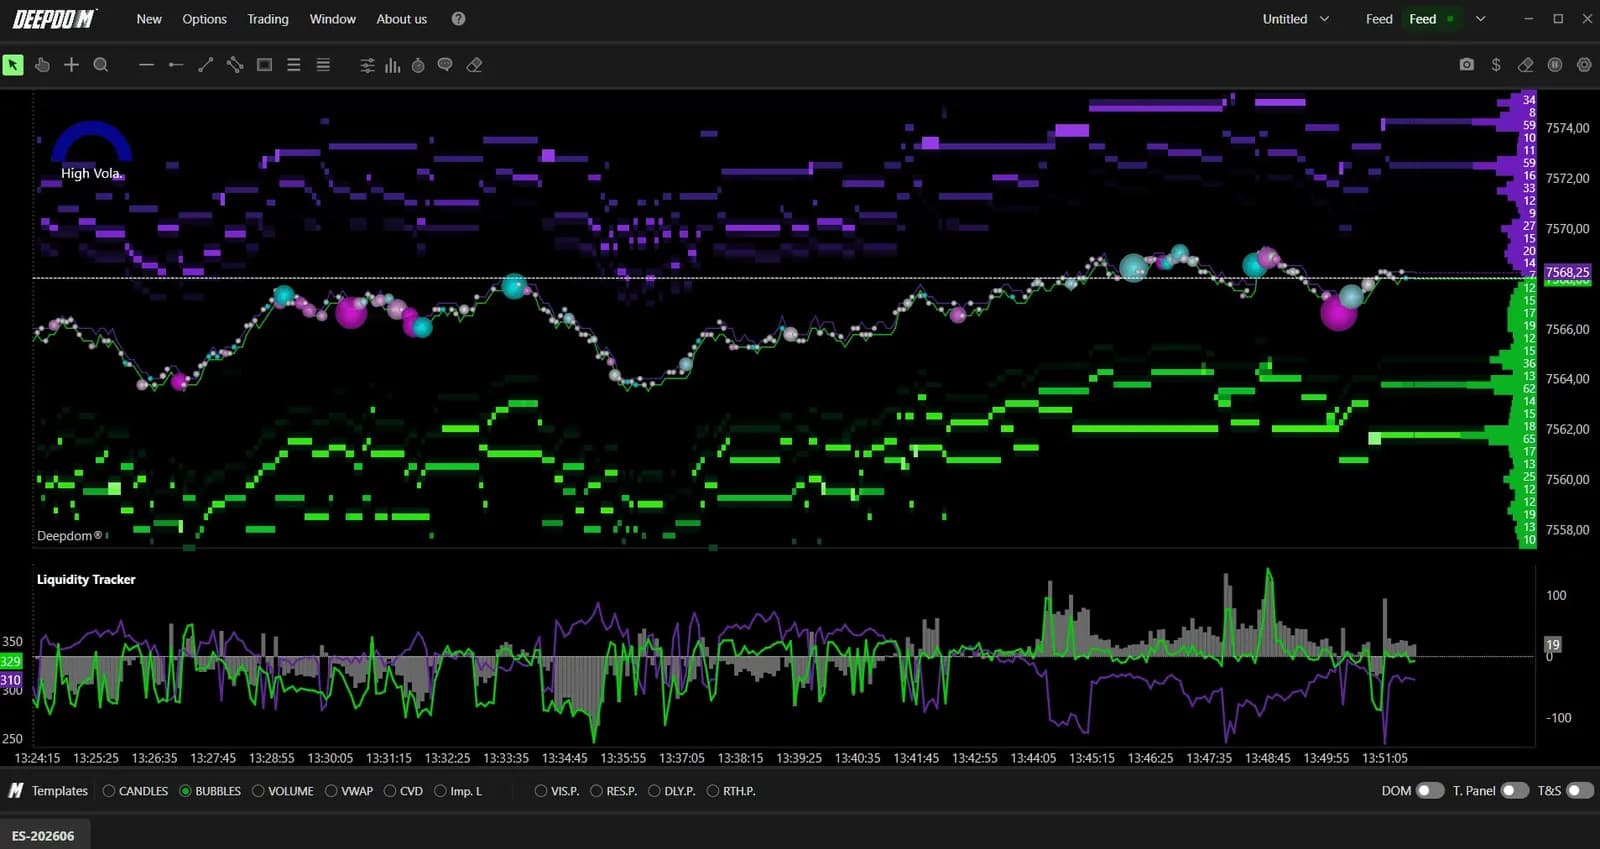
A liquidity heatmap shows you where size rests in the book, but it leaves two questions to your eye: is there more resting on the bid than on the ask right now, and did fresh size just arrive near price? DeepDomOFF answers each with a dedicated indicator. Deep Liquidity Scan turns the book into numbers, bid against ask, plotted as curves with their difference. Deep Reload marks the instant new passive liquidity is posted close to price, with a colored band on the chart.
Both read the book order by order, which is why they need a DeepDomOFF license and a depth feed. They are context tools, built to tell you which side is leaning on the book and when someone just reloaded, so the trade you take at a level rests on more than a bright line.
What Deep Liquidity Scan measures
Deep Liquidity Scan adds up the passive liquidity resting on the bid and on the ask across a book depth you choose, and plots both totals with their net difference. Where the heatmap is a picture, this is a measurement. On the chart its pane is labeled Liquidity Tracker. If the book itself needs a refresher, the glossary entry on the DOM and reading the liquidity heatmap cover the ground first.
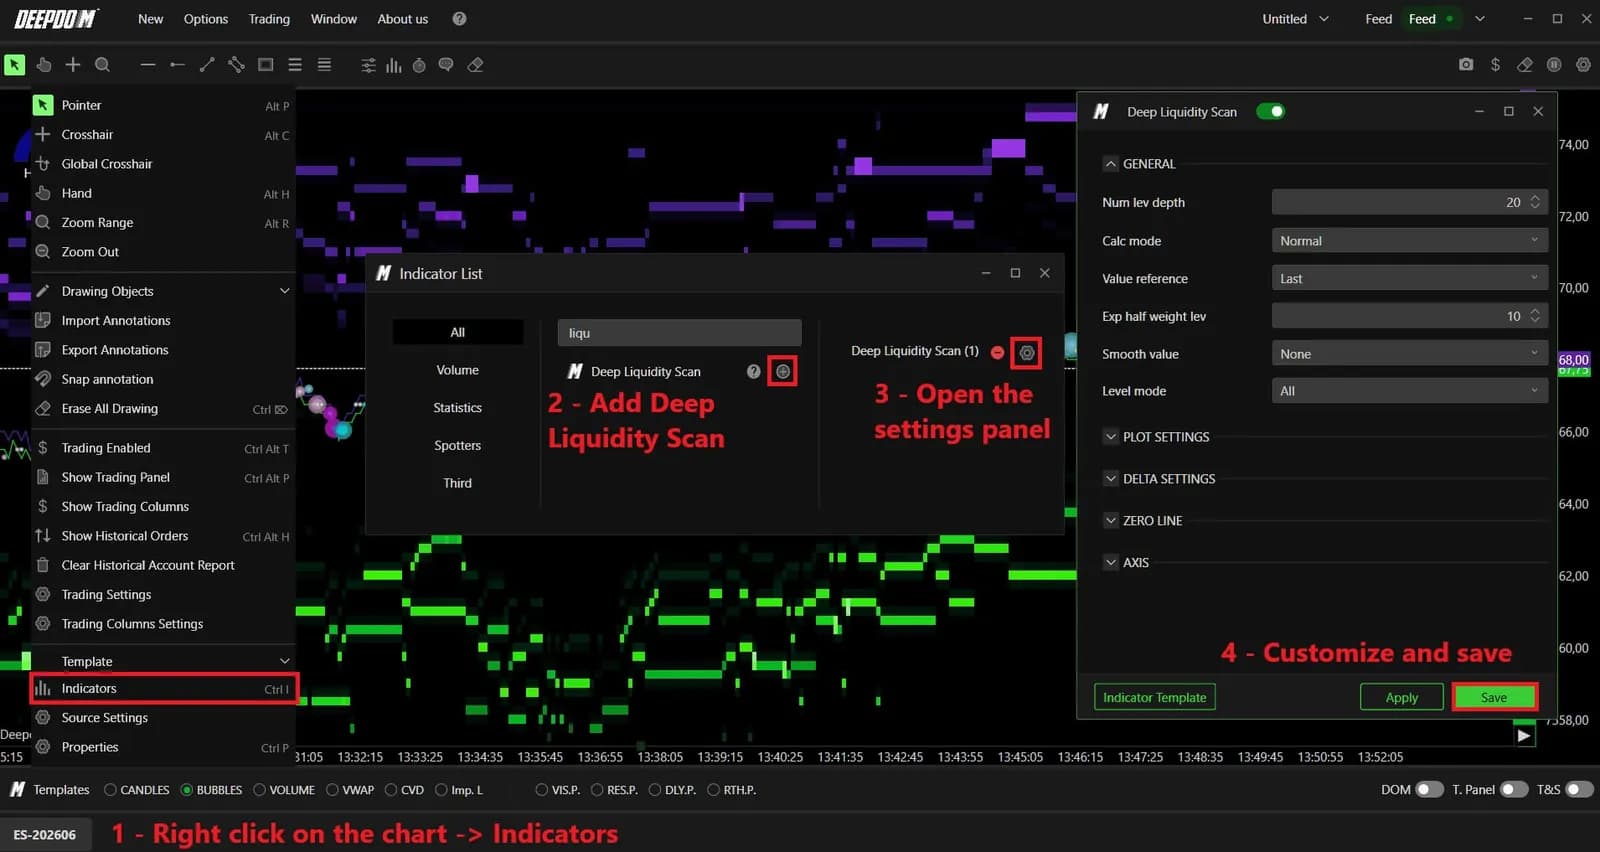
You add it with a right click on the chart, then Indicators, or Ctrl I. Search for it in the Indicator List, add it with the plus button, and open its gear. Apply tests a change without closing the window; Save keeps it.
The one section that changes the data
Of the five sections in the settings window, only GENERAL changes what is measured; the other four only change how it looks. Its most important field is Num lev depth, 20 by default. That is not a precision setting, it is a choice of question. Twenty levels near price describe the next minute of trading. A much wider depth describes the structure of the session. Both are correct and they can disagree, so pick the depth from the decision you are preparing and keep it fixed through the session.
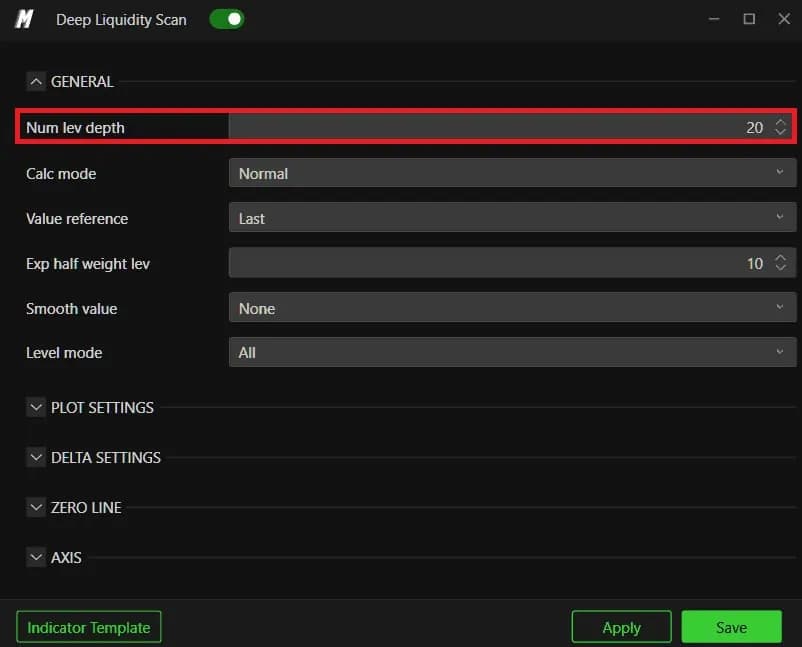
Calc mode, on Normal, counts every level the same, which suits a structural view. Exponential gives more weight to levels near price, at a rate set by Exp half weight lev, 10 by default. For an entry decision Exponential fits better, because size fifty ticks away is unlikely to be touched before you act.
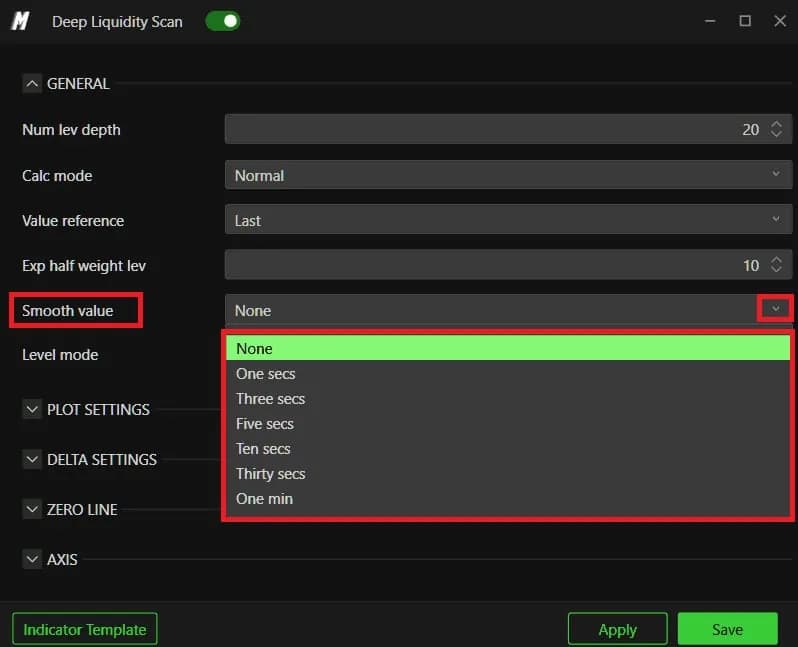
Smooth value calms the reading. It starts on None and goes up to One min. On ES and NQ the raw curve moves too fast to read live, and three to five seconds makes it usable. Go further and the pull you wanted to catch shows up late.
Fresh or persistent: telling a real wall from a flicker
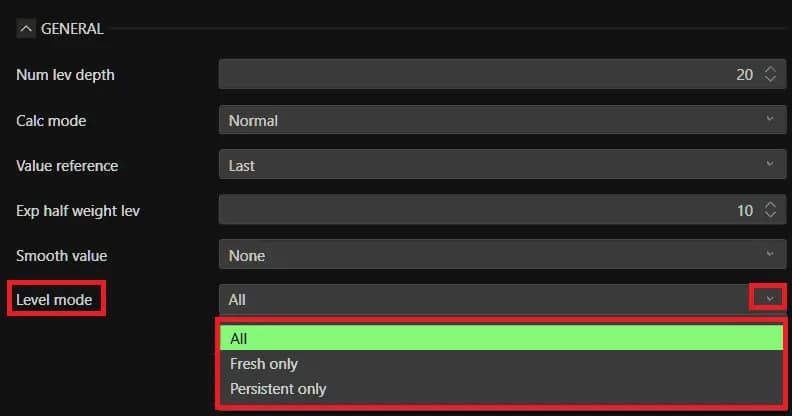
Level mode is the filter that changes what the scan is asking. All, the default, counts every order. Fresh only keeps recently posted orders, which shows intent building while a level is being tested. Persistent only keeps the liquidity that stays, and it is the clean way to tell a real wall from a stack of orders that come and go.
Below GENERAL, the DELTA SETTINGS section is already on and draws the bid minus ask gap as its own series. Show it as a histogram: the zero crossing jumps out. The AXIS section ships correctly set, Bid ask axis on Secondary and Delta axis on Primary. Volumes run into thousands of contracts while the delta swings around zero, so this split keeps the delta readable. If your pane ever shows a flat delta line, check this section first: an imported template may have swapped them.

Deep Reload: marking fresh liquidity as it lands
Deep Reload, also called the Fresh Liquidity Detector, draws a vertical band at the moment meaningful passive size appears near price. Green bands mark deposits on the bid, purple bands on the ask, with horizontal lines at the price concerned. It draws events, not a curve: each band records something that just happened in the book.
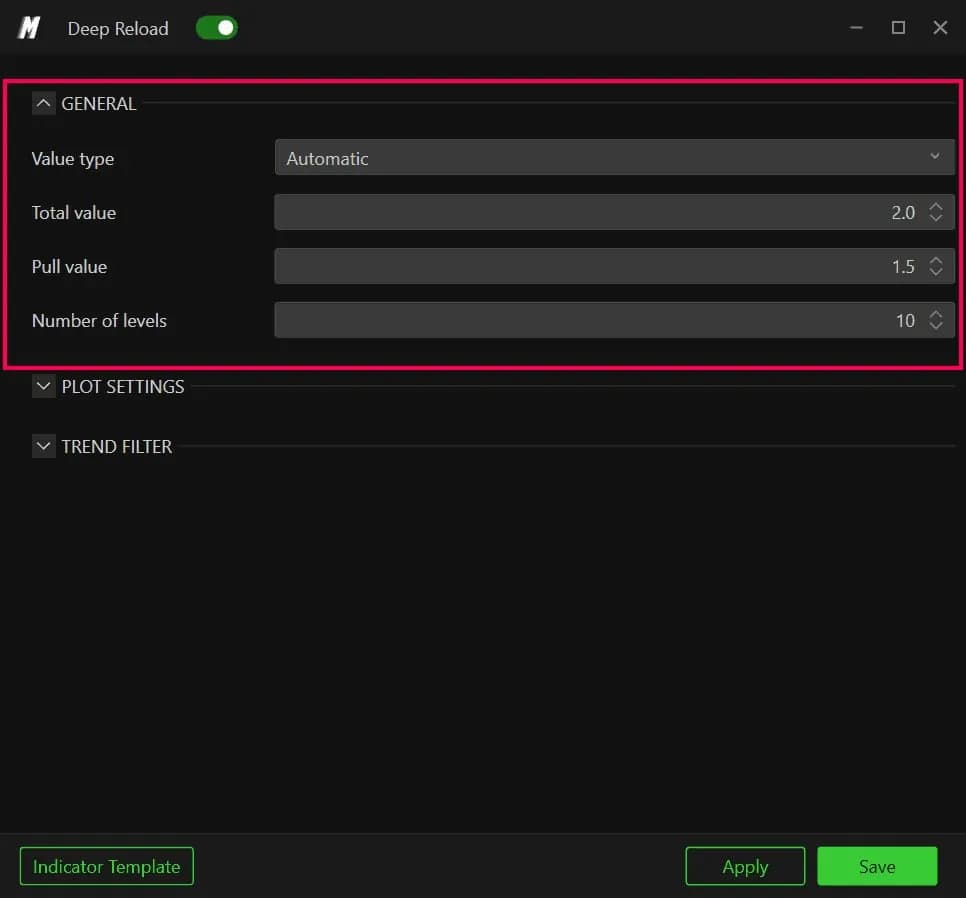
The GENERAL section holds the four fields that matter. Value type starts on Automatic, which calibrates the threshold for you and suits anyone who changes instruments often. If you trade one contract every day, switch to Manual so two sessions are judged by the same rule. Total value, 2.0, is the fresh volume threshold that triggers a band and decides how busy the chart gets. Pull value, 1.5, sets the minimum size removed or changed for an event to count. Number of levels, 10, is the width of the watched zone; widen it and Total value has to rise with it.
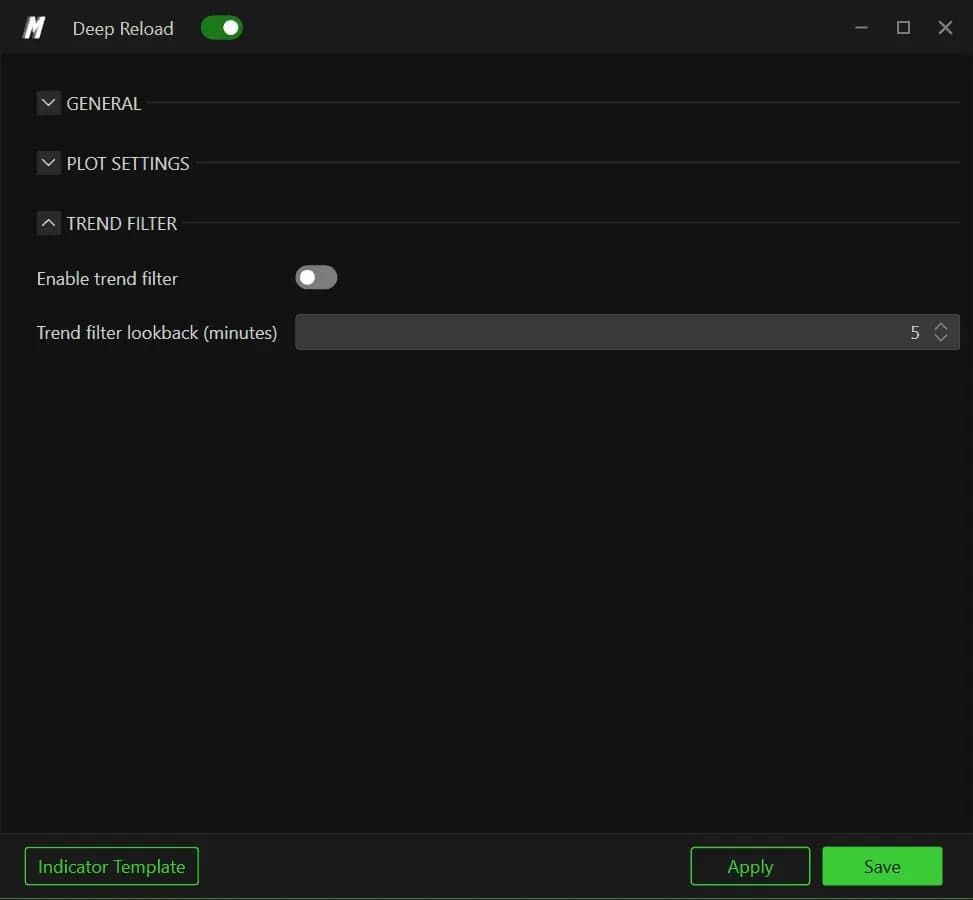
PLOT SETTINGS change nothing in the calculation and a lot in daily use. Opacity at 40 keeps the bands from hiding the candles. Plot min bar width, 2, keeps a mark visible when you zoom out, and Plot max ticks, 20, stops one spread-out deposit from covering the screen. The TREND FILTER section ships off, with a 5 minute lookback when enabled. Leave it off while you learn the tool: liquidity rebuilding against the trend is often the most interesting band of the day.
| Setting | Default | What it changes |
|---|---|---|
| Num lev depth (Scan) | 20 | Book depth summed: next minute or session structure |
| Calc mode (Scan) | Normal | Equal weight per level, or more weight near price |
| Smooth value (Scan) | None | Steadier curve, at the cost of a later signal |
| Level mode (Scan) | All | Fresh only or Persistent only isolate intent or durability |
| Value type (Reload) | Automatic | Manual keeps thresholds the same from one session to the next |
| Total value (Reload) | 2.0 | Fresh volume needed to draw a band |
| Number of levels (Reload) | 10 | Width of the zone watched around price |
| Enable trend filter (Reload) | Off | Hides bands that go against the recent trend |
Reading both in a session
The two indicators are read together: the scan tells you which side of the book is heavier, and Deep Reload tells you when that side just added size. Take a hypothetical ES morning. Price pulls back toward a level that held the day before. The scan, on twenty levels in Exponential mode, shows the bid curve rising above the ask and the delta histogram crossing above zero. As price reaches the level, Deep Reload drops two green bands: fresh bids are being posted right where the test happens.
That is a level being defended in real time. Switch the scan to Persistent only for a moment: if the bid side holds up, the size is staying, not flickering. If instead the bid curve sags and no green band appears as price arrives, the support you saw on the heatmap was not being reinforced, and the level deserves less trust. The same logic applies when Deep V Tracker prints an absorption line: a reload band at that price backs it with fresh size.
Where it fits on a prop firm evaluation
On an evaluation, these tools are most useful for deciding whether a level is worth risking a stop behind. A level backed by persistent liquidity and fresh reloads gives a cleaner place for the stop than one where the book is thinning. The scan and the bands are context, not orders: passive size can be canceled in one click, so the trade still needs the tape to confirm. Plans and the DeepDomOFF license are listed on our platform page.
Prop firms that run DeepCharts